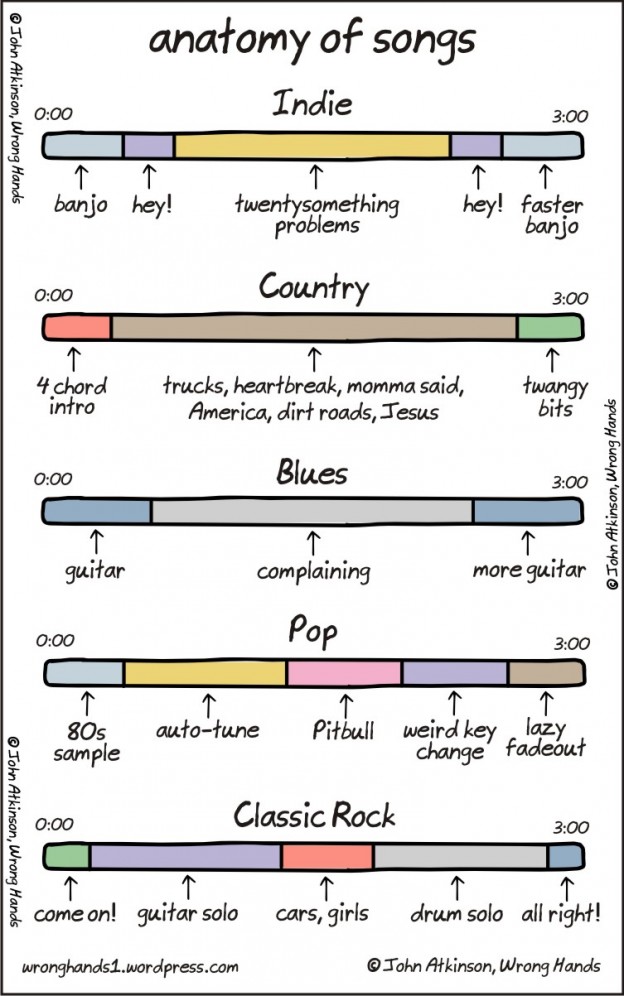
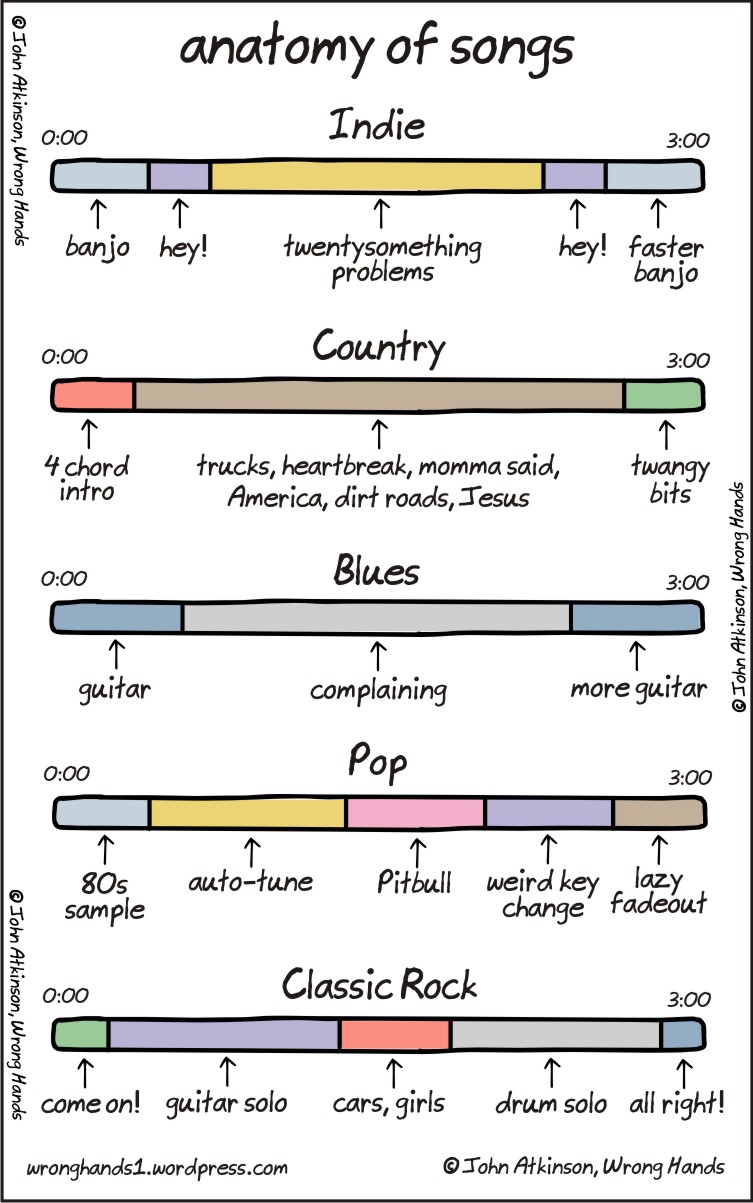
I found this fun visualisation of the anatomy songs from different musical genres. Its obviously not serious (or based on any actual data) but I like the implementation 🙂
Data Visualization
I found this fun visualisation of the anatomy songs from different musical genres. Its obviously not serious (or based on any actual data) but I like the implementation 🙂
The stock market prediction scam is an old scam, and its nice to see that it has been updated to use social media a bit better.
How to Flawlessly Predict Anything on the Internet

Here is a video showing various sorting algorithms in action. And if you have time, here is Mike Bostock un-sorting things using d3.
Watch John Oliver deliver a masterful lesson in Data-Ink Ratio for television.
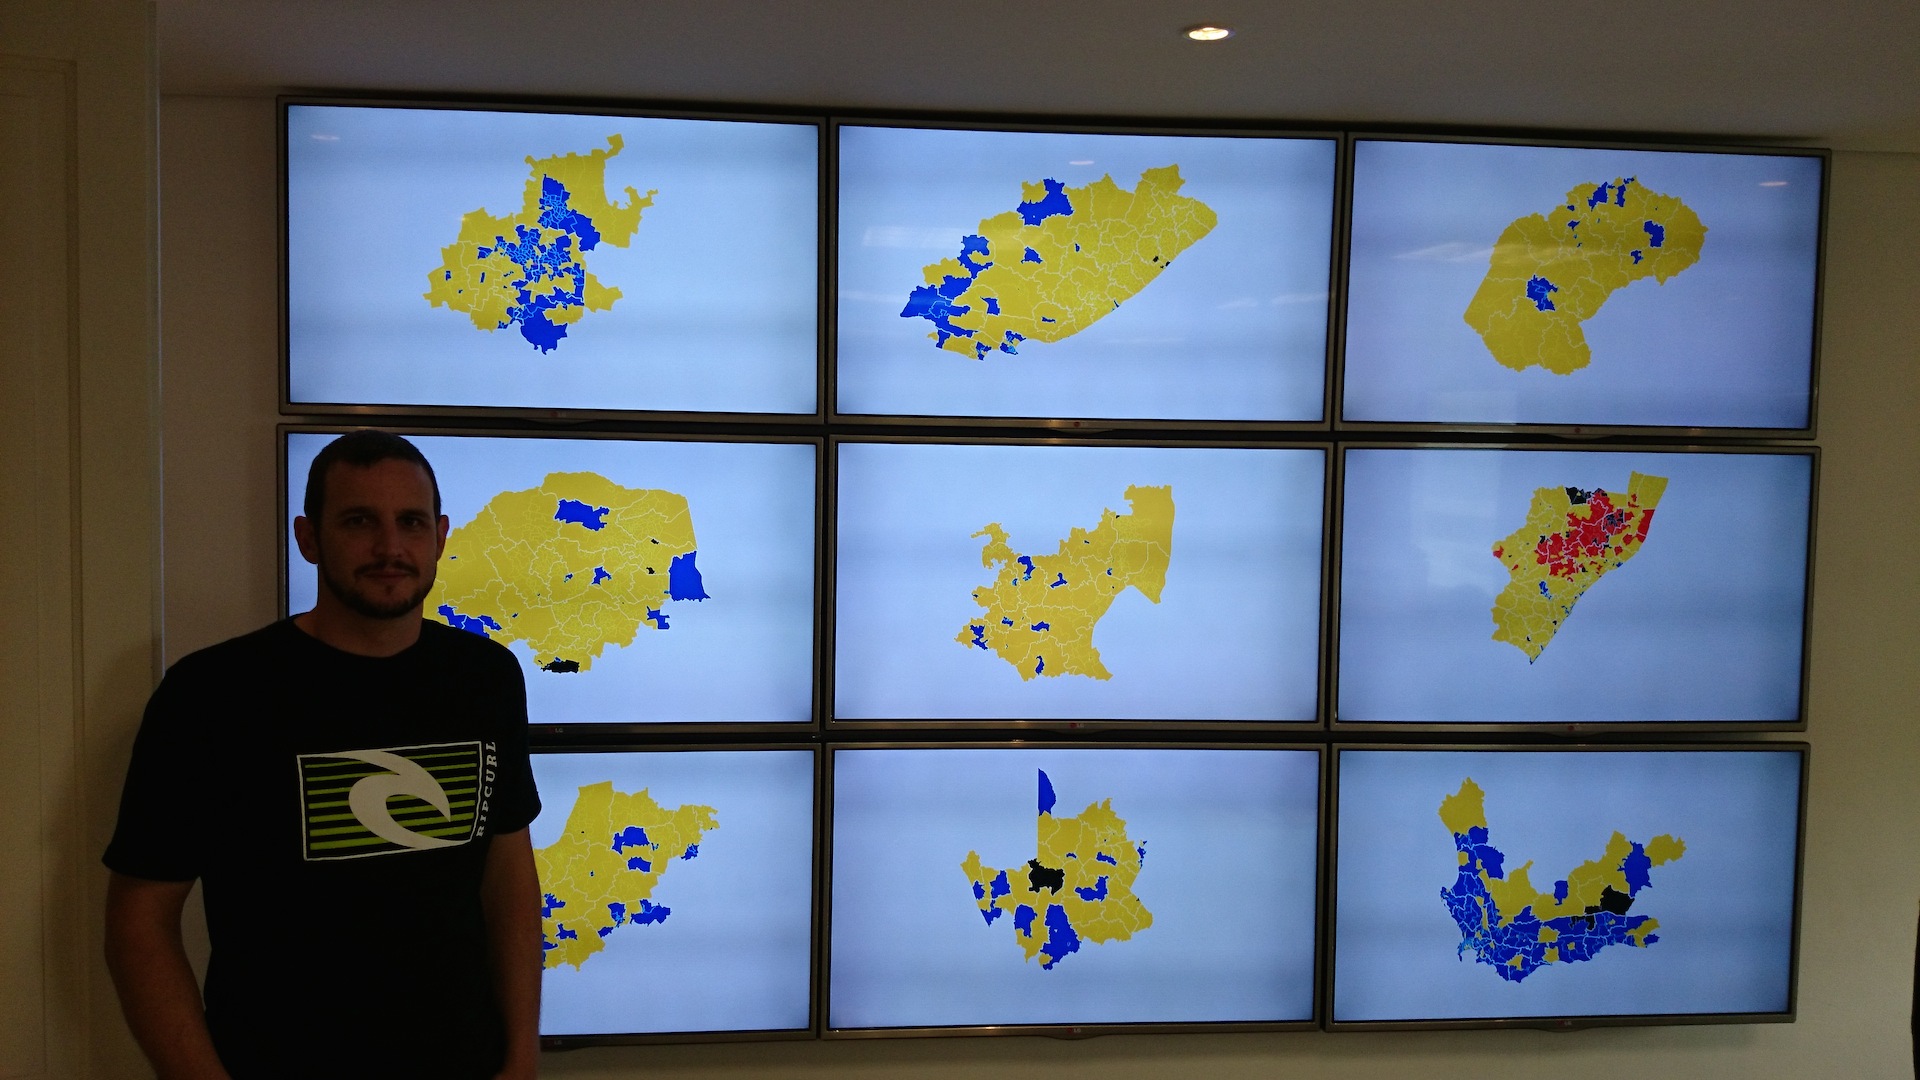
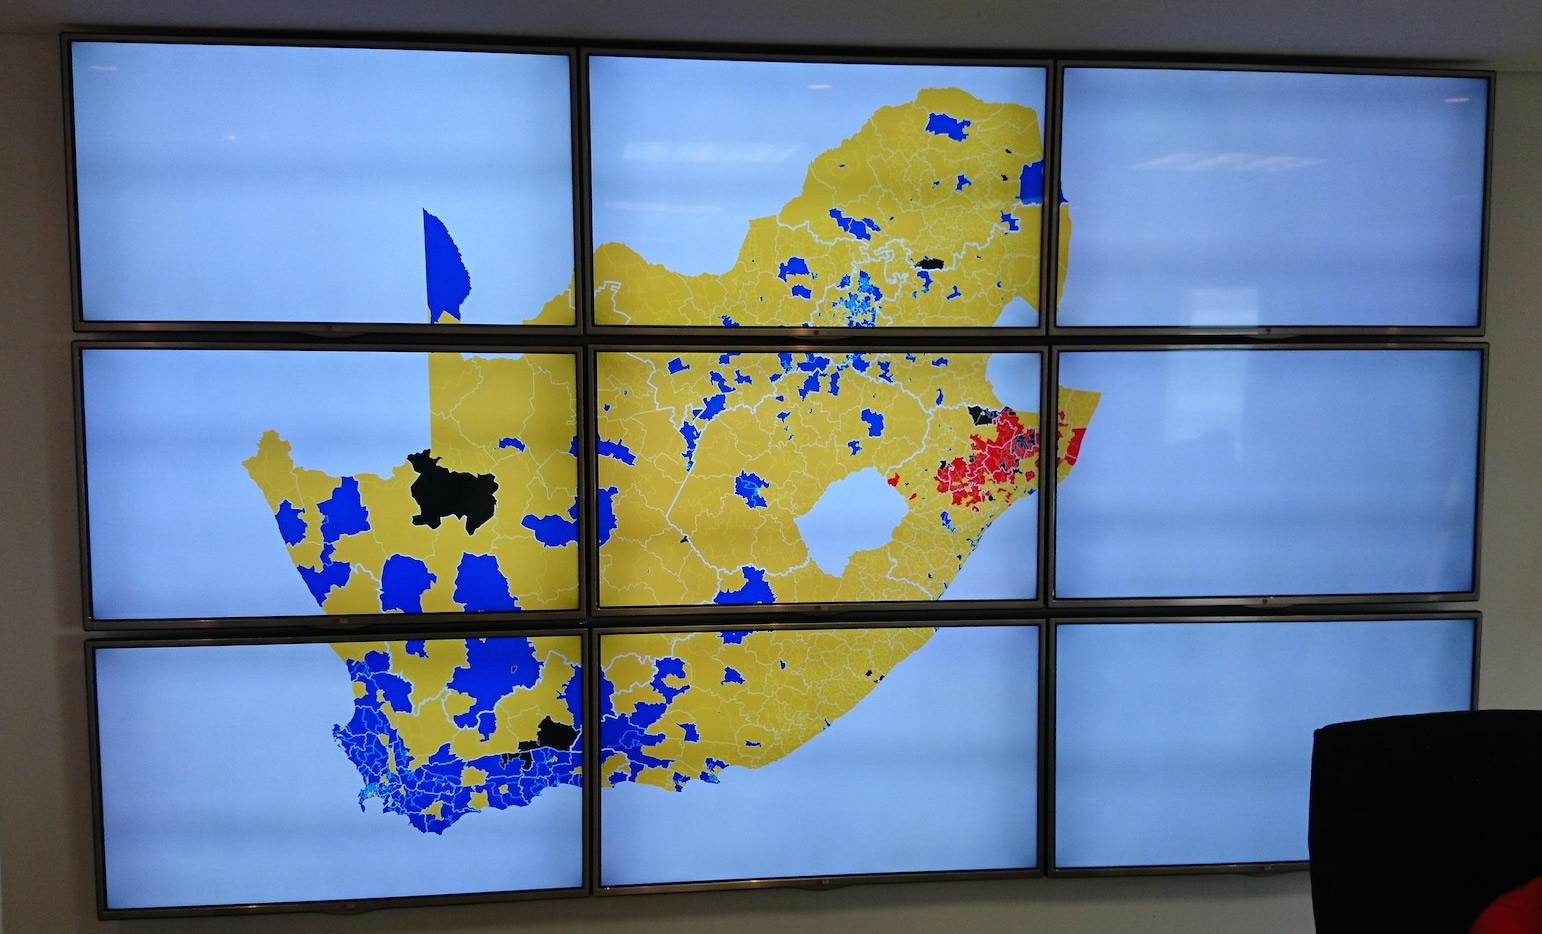
May was an interesting and fun month. I finished a project to build a big 3 x 3 TV wall display to be used at a call centre for the 2014 elections. The requirement was to have 9 screens all operating independently that can have individual images sent to each screen or a single image zoomed across all 9 screens.
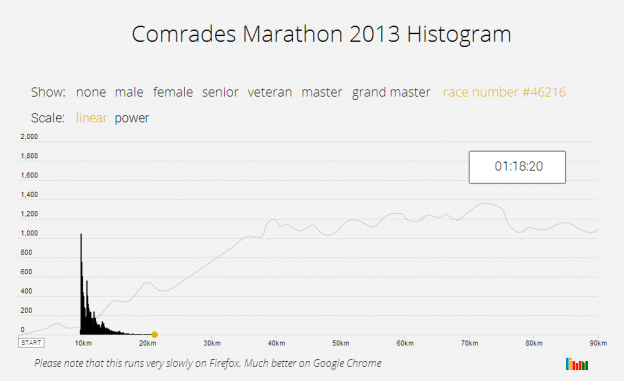
 I do occasional Park Runs and trail runs. On a recent run I started to wonder what the distribution or histogram of runners looks like. It would be a big moving blob at the start that slowly thins out as the faster runners pull away from the slower runners. The shape will depend on the race distance and the number of runners. I first did it for the Comrades Marathon in 2014, and now again for the JP Morgan Corporate Challenge. The shape will depend on the race distance and the number of runners. Continue reading “Mapping Runners”
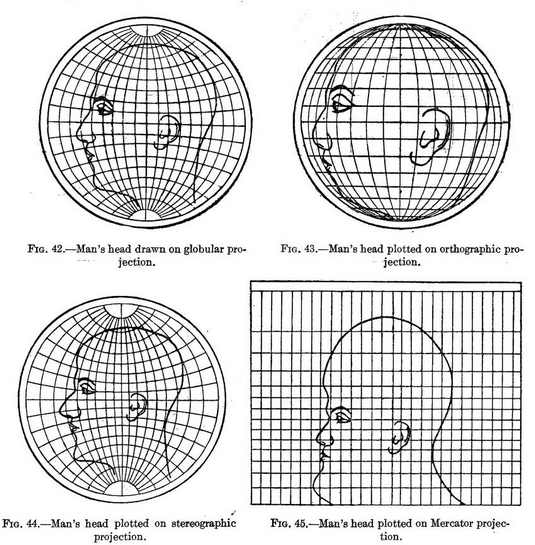
An image has been doing the rounds that shows the distortions introduced when reducing a 3D earth to a 2D representation. Like all those huge maps we used to have on our walls with pins in them to show where you’ve travelled. The drawings used in the original work show the distortions as applied to a human head, something we are familiar with.
Plotting the flight paths of airplane traffic seems to be a new branch of data visualisation on its own. The most recent video doing the rounds is this one:
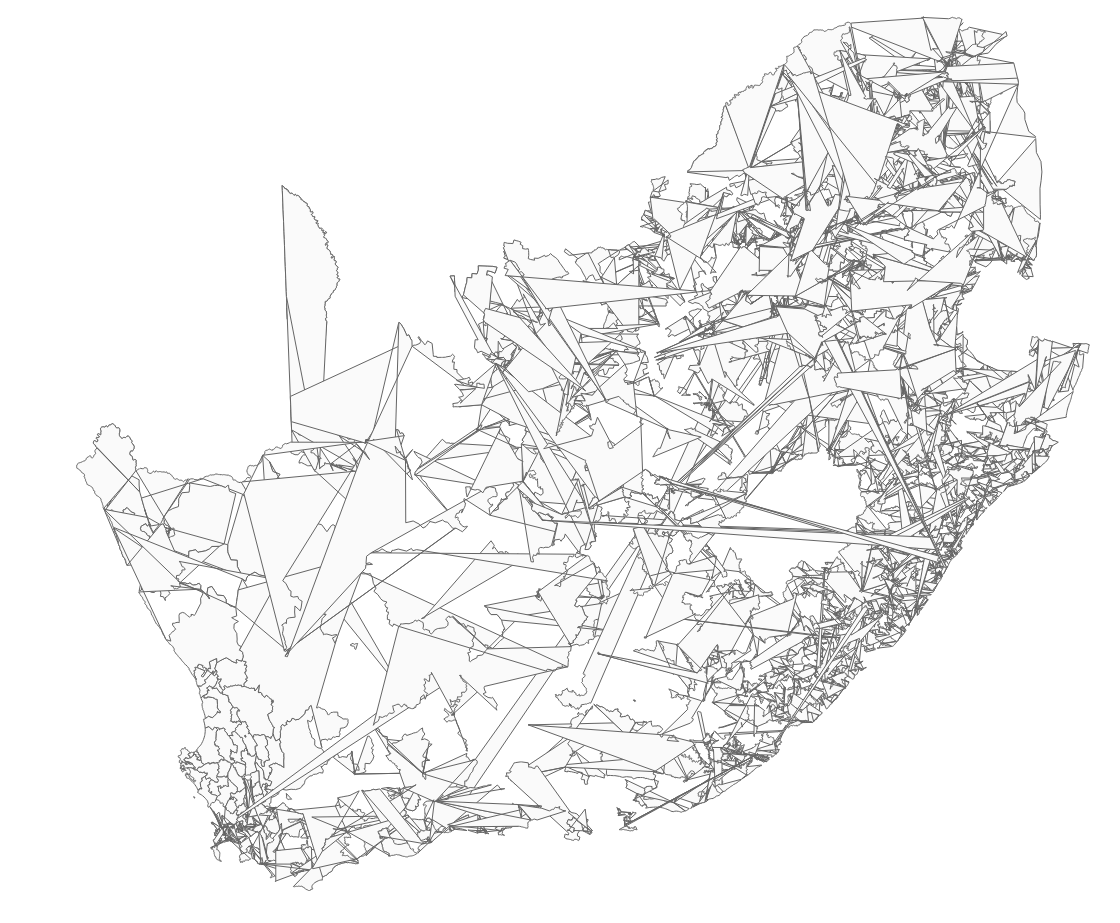
Mike Bostok has a fantastic tutorial on how to make a map using d3 and topojson. Having done some mapping work recently for a client, I was keen to learn more and try do a d3 based cartogram. I found some good examples of non-contiguous cartograms, but I wanted to make a South African version of a contiguous one using Shawn Allen’s d3 implementation.
Here is the final product, and I’ll take you through some of the tricky parts that I had to deal with.
While working on making a d3 based cartogram, I accidentally made a new map of South Africa. I dig it!