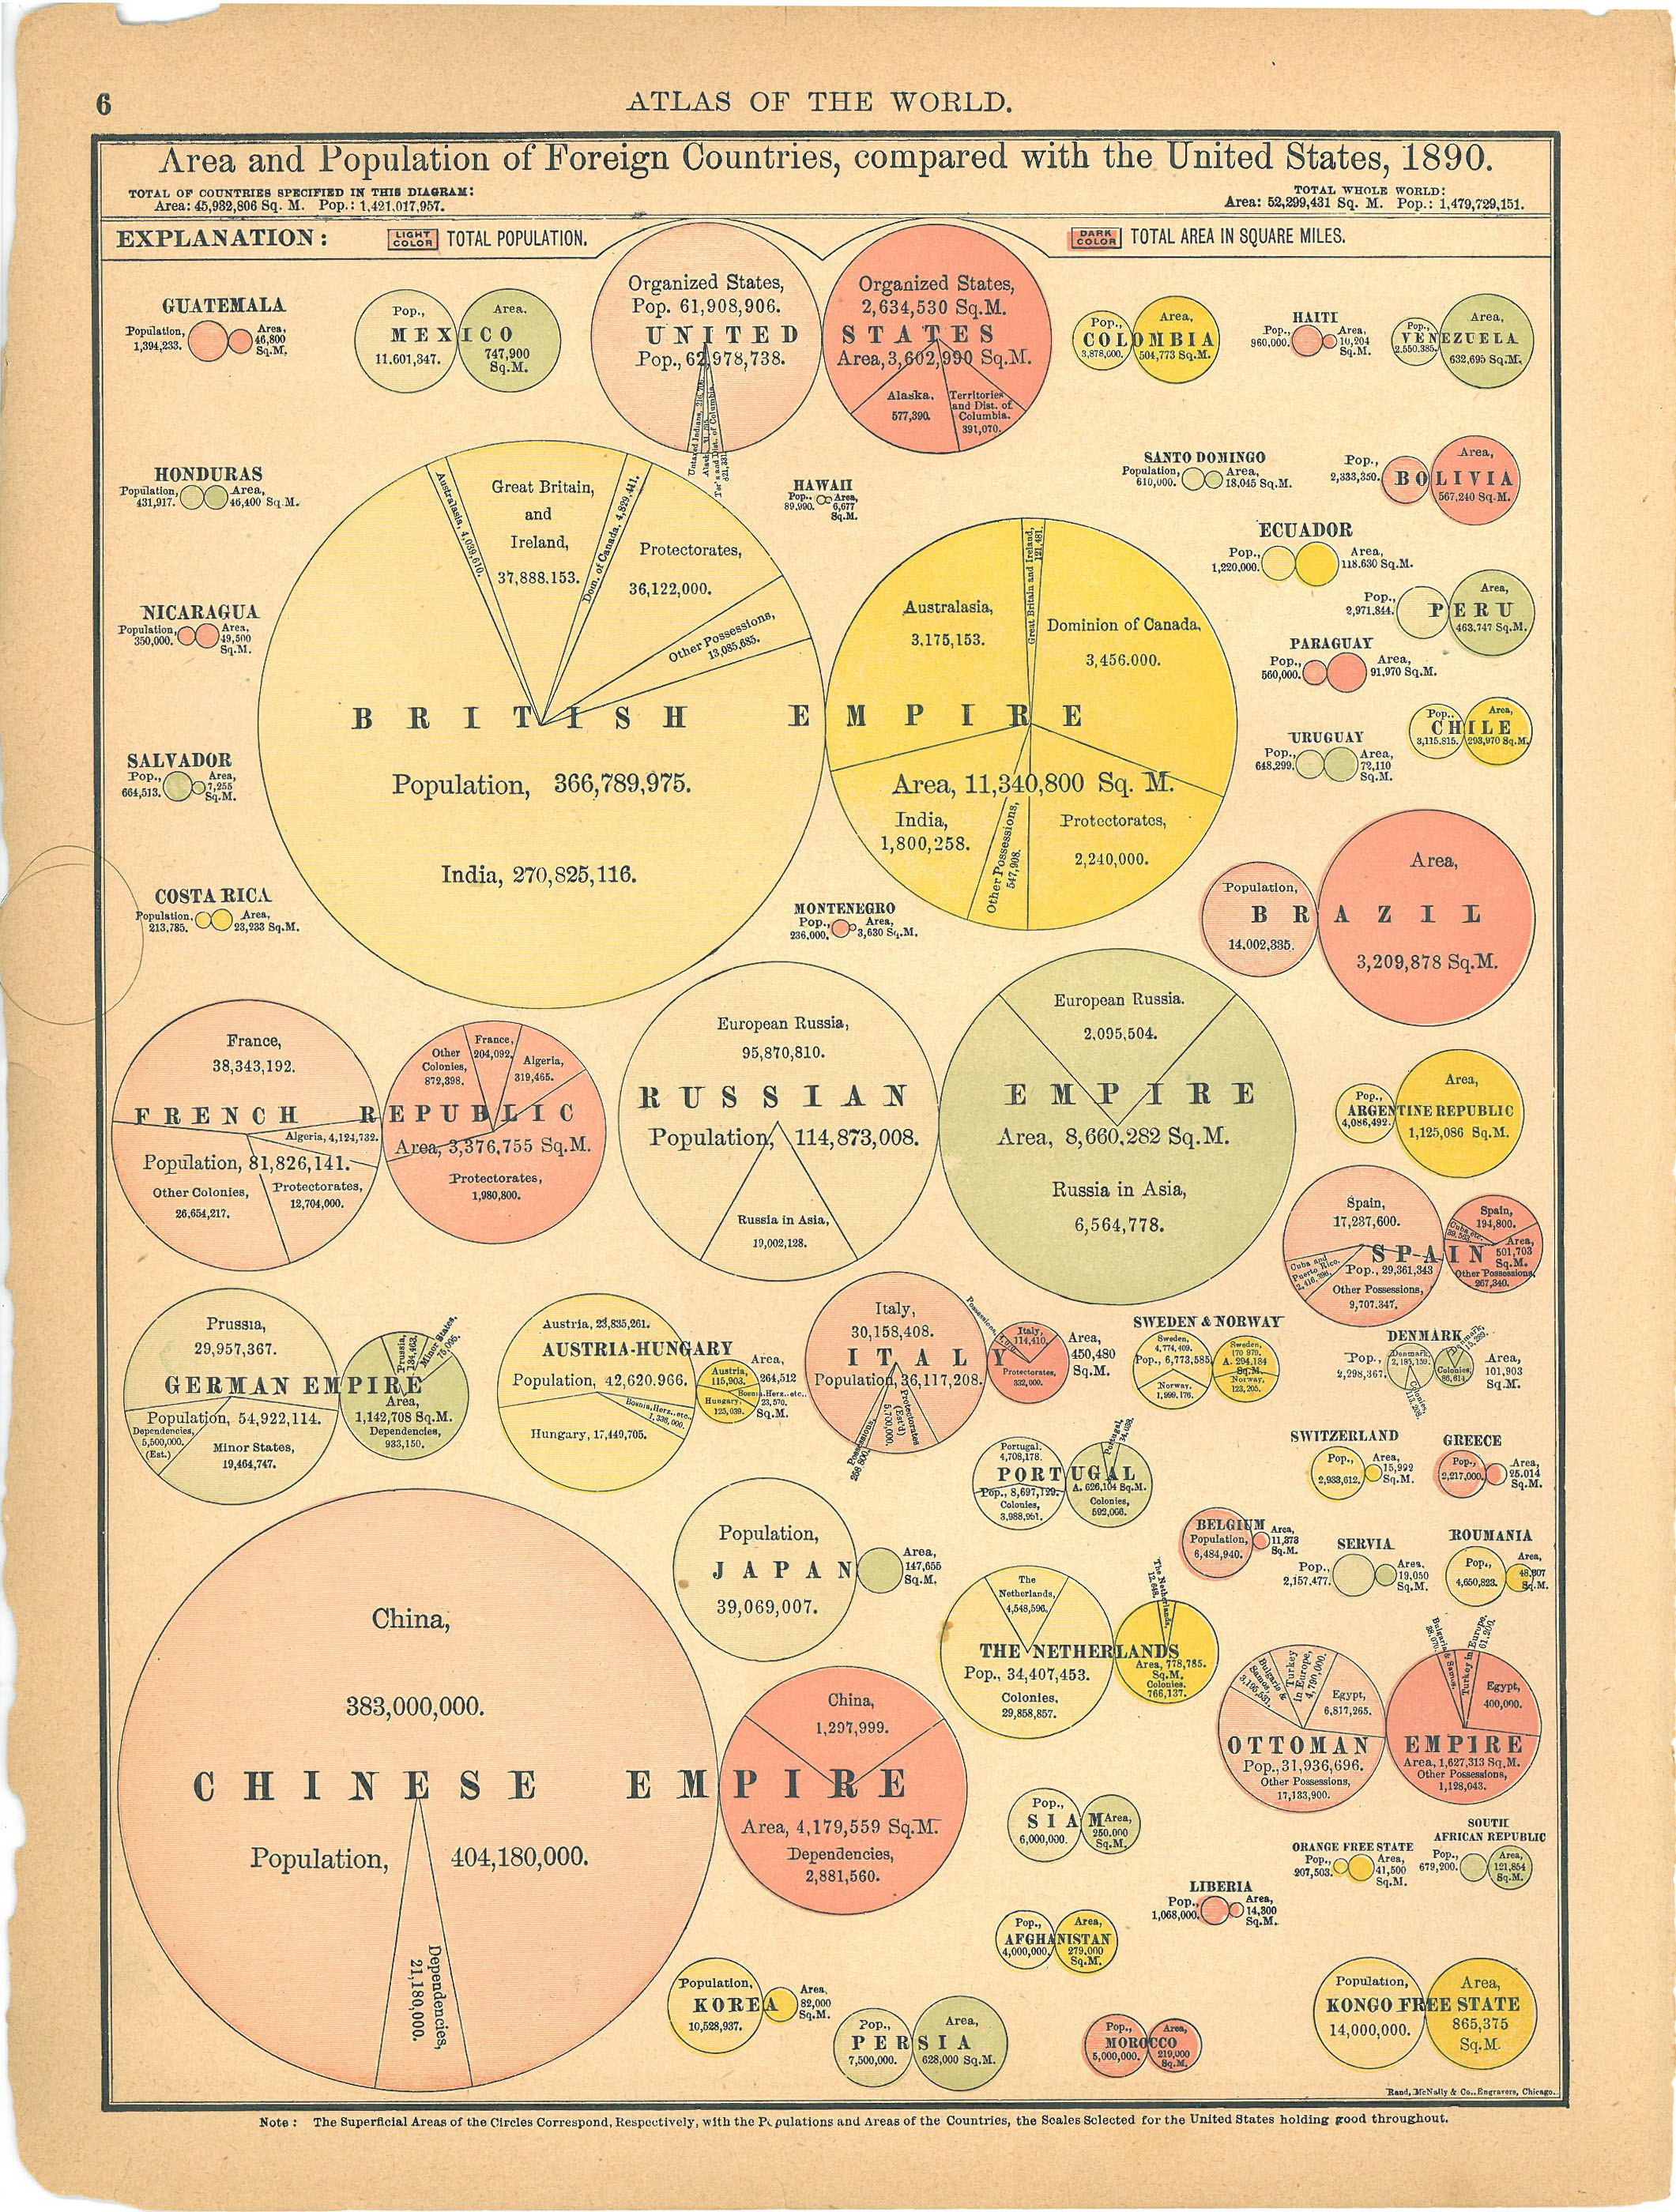
I know it seems preposterous, but data visualistion predates the the computer. Its true! There were the pioneering people who used pen and paper and had enough free fingers to do the necessary calculations since they weren’t holding onto phones. No PowerBi or Tableau in sight. It was a better time. Things took longer but there was no Neflix, so people had more time to spare.
The time in particular is 1890. Much of the work in what was known as the visual sensemaking field focused on cartography, with occastional excursions into representing data. Below are some images from the Rand McNally World Atlas published in 1890. You can read the more about it here:


