Limn (verb)
 1. Depict or describe in painting or words.
  - also: This site, dedicated to the art of data visualisation.
River Map of South Africa
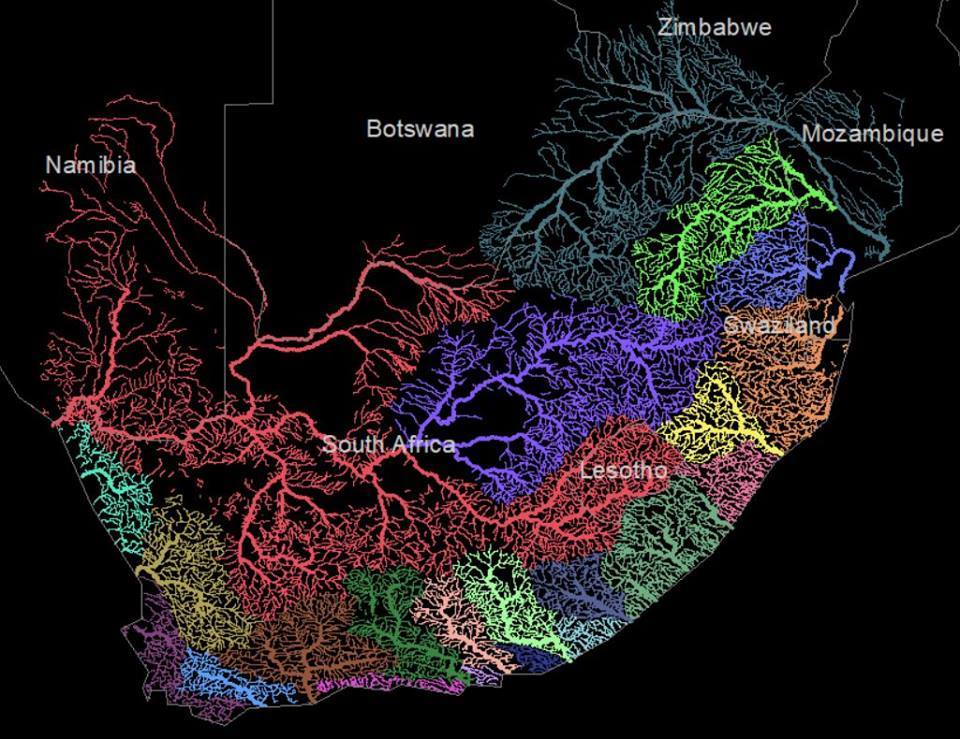
When its not devolving into bitter online arguments – which is often – the South African subreddit has some useful stuff about the country, such as this river map from Sukhmani Mantel. Continue reading “River Map of South Africa”
Ant Graphs
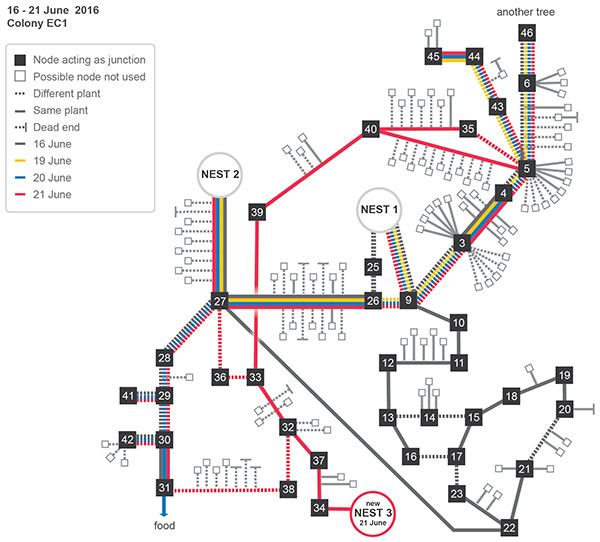
I’m a reasonably avid user of Pocket. For the last few years I have been conferred with the dubious glory of being in their top 5% of “readers” for the year. Its another pile of things to read that I try to get to, but usually don’t. However when I’m travelling I load up the articles on my Kobo (a.k.a. the thrifty Kindle) and try get through as much as a I can on the plane before I loose the will to live and try end it all with airline food. Continue reading “Ant Graphs”
D3 v4 in Jupyter Notebooks
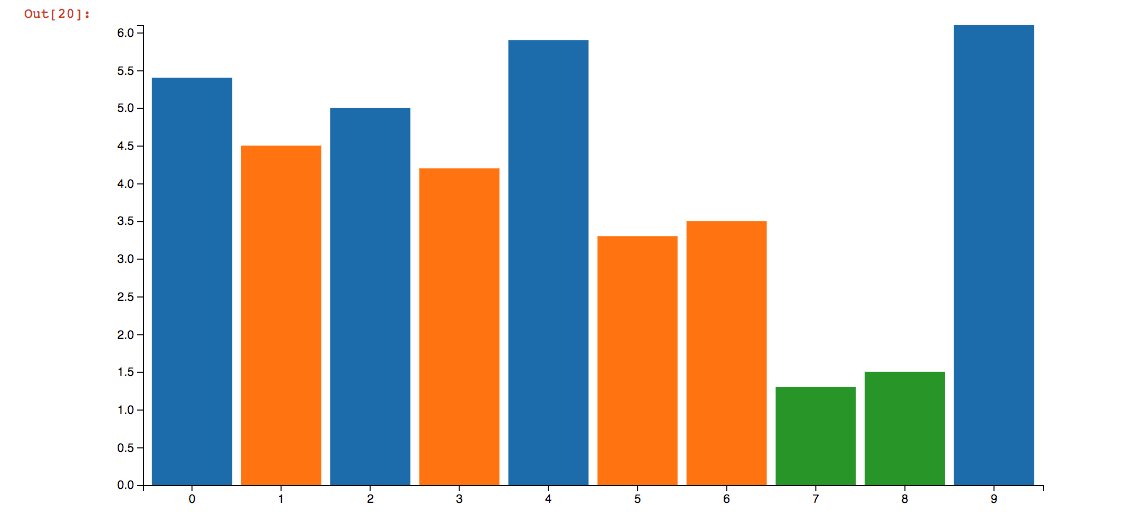
I have recently started doing some data viz work with Jupyter Notebooks. The specific requirement has been getting data from Spark into D3 and using Jupyter is a quick way to do that as it has robust pyspark support. Continue reading “D3 v4 in Jupyter Notebooks”
Two neurons are riding a bicycle

This is what it looks like when you simulate pushing a bicycle and just let it fall over. 800 times. Continue reading “Two neurons are riding a bicycle”
PSL Analysis from 2002 to Current Season
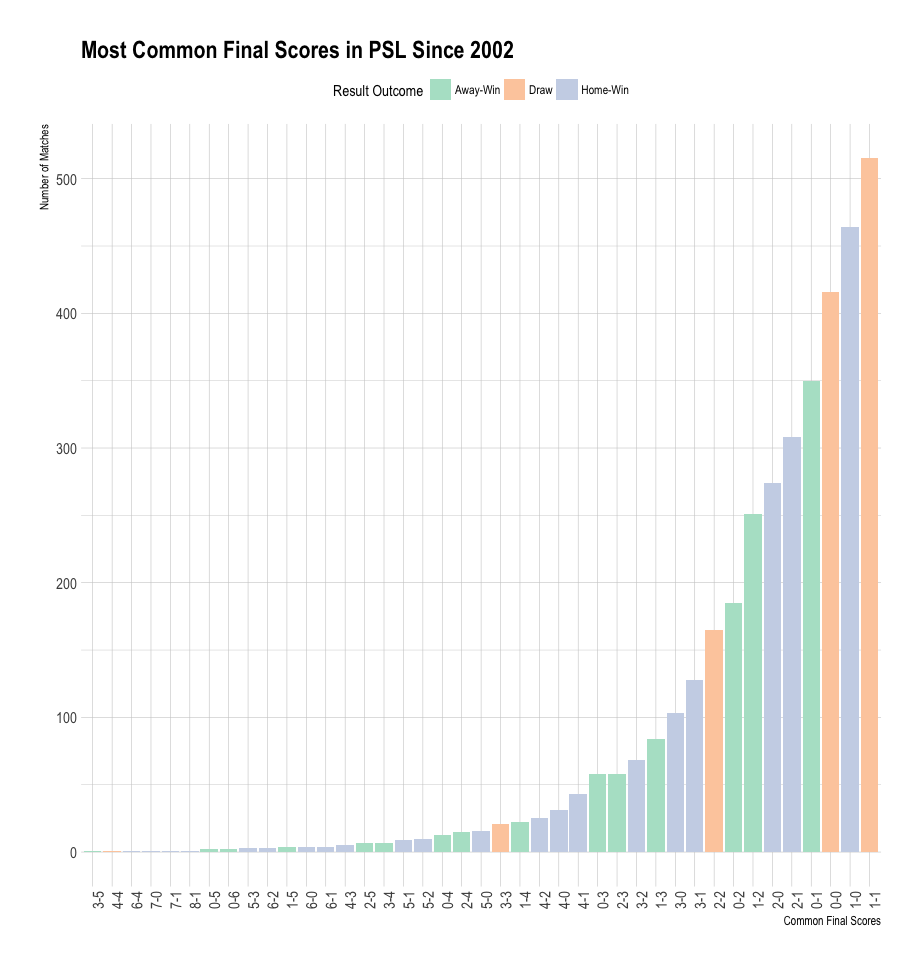
A guest post from Sbusiso Mkhondwane
Introduction
I have been going back and forth for a while about doing some form of data analysis and sharing it. The first attempt was to collect the data for my car’s movement, from the locations I visited to the car’s speed. I have four years worth of data and in a tidier format. Part of the reason for wanting to do data analysis was the R language and the http://r4ds.had.co.nz book. R appeared like a tool that allowes you to feel as if you are in control and it’s flexable. What do I mean here? Hadley Wickham once said something along these lines; “The different between R language and other languages: Programming languages provide contracts. These are the things you can do and these are the things you can’t do. In many programming languages that’s like a legal contract. It spells out explicitly like what you can do and can’t do, and things you can’t do there’s no way you can do them. While with R, it’s more like a contract between friends, like you really shouldn’t do this but if you really want to, you can go ahead and do it.”. Another plus for doing this is to improve my data science skill and hopefully get some useful advise from the R community. Continue reading “PSL Analysis from 2002 to Current Season”
Peak Rationality
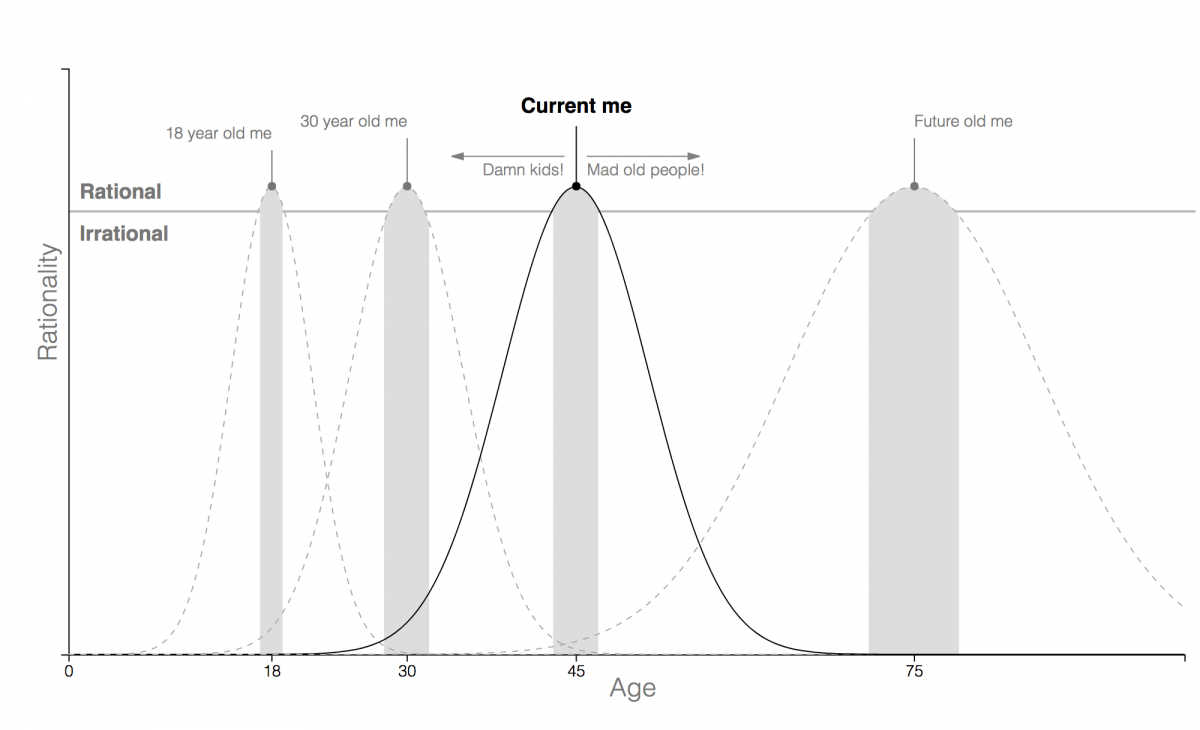
This is the first of a series of semi-weekly visualisations. “Semi-weekly” in this case is ambiguous, like bi-weekly is, so like whenever. It will be depictions of a concept or thought (or even actual data) when time and inspiration coincide. Continue reading “Peak Rationality”
Seeing Theory
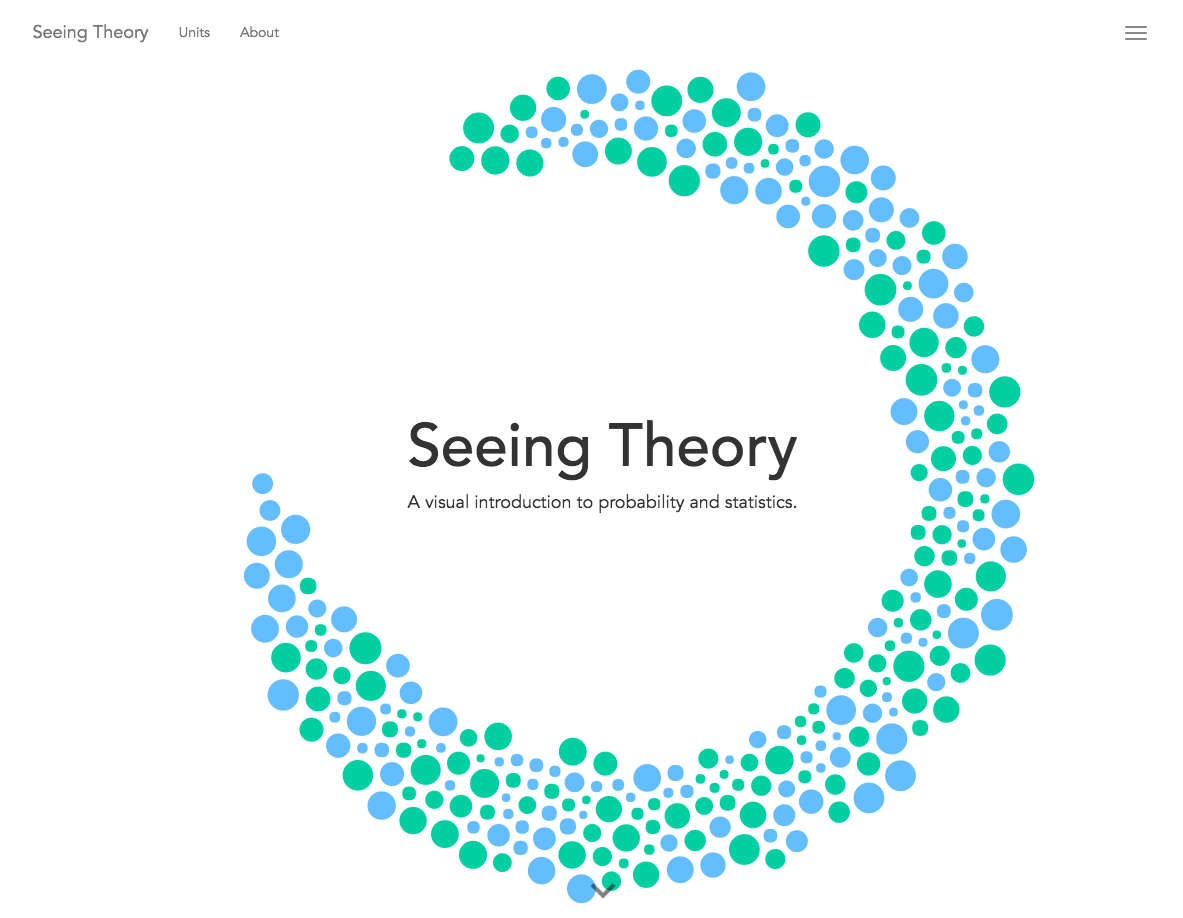
Not a lot to say, this is just really awesome work. If you have ever studied statistics and wanted a better visual explanation, go here. And D3 based too!

2 Years of Running Visualised
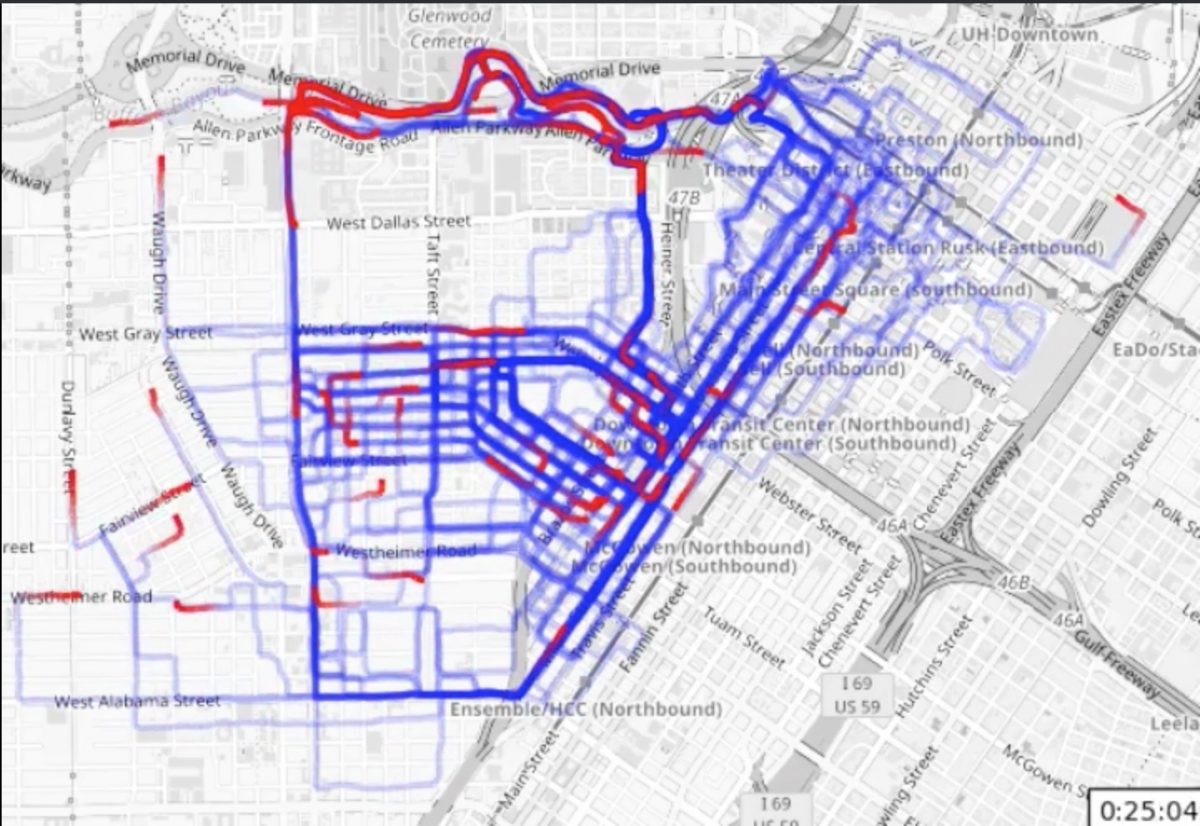
Speaking of visualising running, the graphic below is 2 years worth of running in the same area, overlaid into one handy animation. Its from this reddit post and is quite fun to watch.
2016 Berlin Marathon Data Visualisation
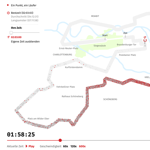
I do like a good marathon data visualisation, I really do. And this one of the 2016 Berlin Marathon is particularly nice.

The Hard Problem of Data Analytics in Africa

One of the attributes of really good technology is that it hides the complexity of what goes on in the background, while still being useful. Depending on how old you are, you may remember having to set up a TV by selecting UHF or VHF with a little switch and then slowly turning a dial until a picture appeared out of the fuzz. Then you’d adjust the “bunny ears” aerial, and twiddle the tuner again to see if you could make the image even better. Continue reading “The Hard Problem of Data Analytics in Africa”