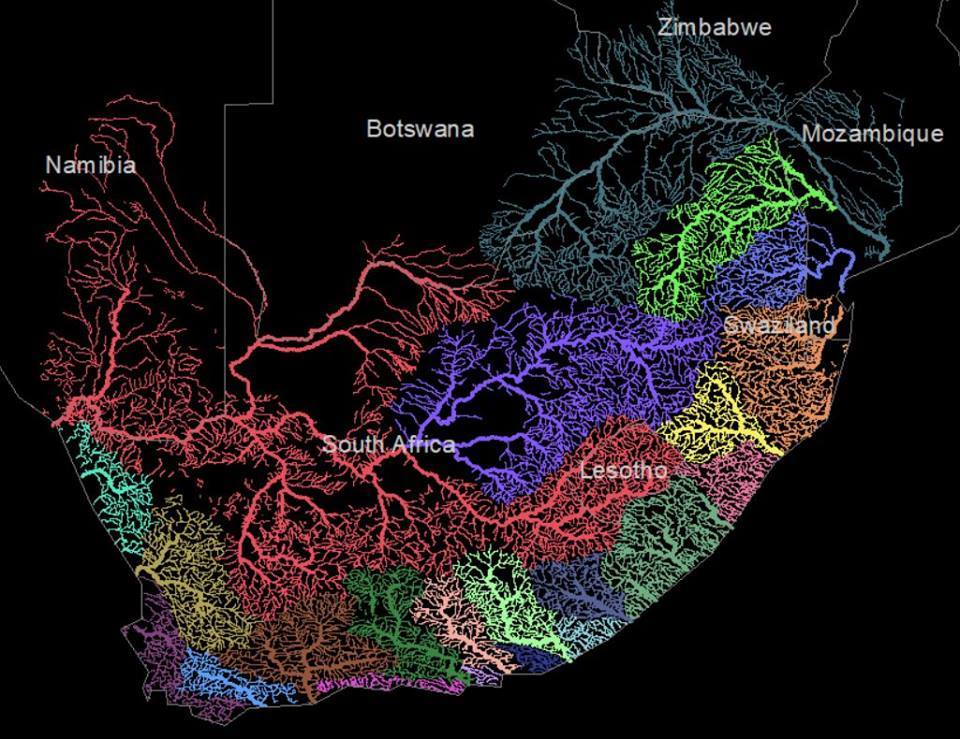
When its not devolving into bitter online arguments – which is often – the South African subreddit has some useful stuff about the country, such as this river map from Sukhmani Mantel. Continue reading “River Map of South Africa”
Category: Uncategorized
Ant Graphs
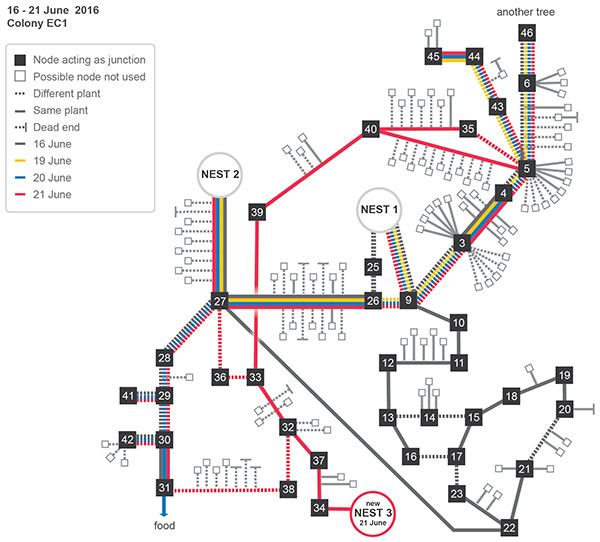
I’m a reasonably avid user of Pocket. For the last few years I have been conferred with the dubious glory of being in their top 5% of “readers” for the year. Its another pile of things to read that I try to get to, but usually don’t. However when I’m travelling I load up the articles on my Kobo (a.k.a. the thrifty Kindle) and try get through as much as a I can on the plane before I loose the will to live and try end it all with airline food. Continue reading “Ant Graphs”
PSL Analysis from 2002 to Current Season
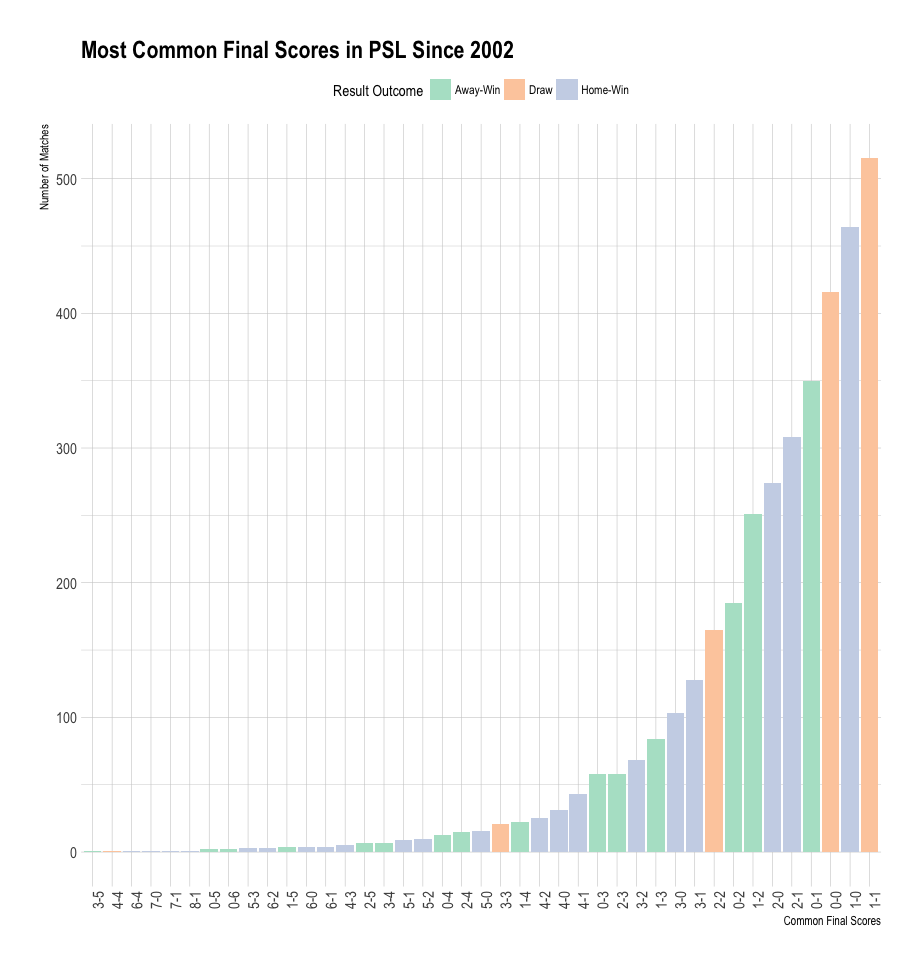
A guest post from Sbusiso Mkhondwane
Introduction
I have been going back and forth for a while about doing some form of data analysis and sharing it. The first attempt was to collect the data for my car’s movement, from the locations I visited to the car’s speed. I have four years worth of data and in a tidier format. Part of the reason for wanting to do data analysis was the R language and the http://r4ds.had.co.nz book. R appeared like a tool that allowes you to feel as if you are in control and it’s flexable. What do I mean here? Hadley Wickham once said something along these lines; “The different between R language and other languages: Programming languages provide contracts. These are the things you can do and these are the things you can’t do. In many programming languages that’s like a legal contract. It spells out explicitly like what you can do and can’t do, and things you can’t do there’s no way you can do them. While with R, it’s more like a contract between friends, like you really shouldn’t do this but if you really want to, you can go ahead and do it.”. Another plus for doing this is to improve my data science skill and hopefully get some useful advise from the R community. Continue reading “PSL Analysis from 2002 to Current Season”
The Hard Problem of Data Analytics in Africa

One of the attributes of really good technology is that it hides the complexity of what goes on in the background, while still being useful. Depending on how old you are, you may remember having to set up a TV by selecting UHF or VHF with a little switch and then slowly turning a dial until a picture appeared out of the fuzz. Then you’d adjust the “bunny ears” aerial, and twiddle the tuner again to see if you could make the image even better. Continue reading “The Hard Problem of Data Analytics in Africa”
New Article on IT News Africa
Here is an article I did on the hard problem of analytics for IT News Africa: http://www.itnewsafrica.com/2016/04/the-hard-problem-of-data-analytics-in-africa/
Let’s Encrypt
I wanted to add SSL to my limn server and found this tutorial at Digital Ocean: https://www.digitalocean.com/community/tutorials/how-to-secure-apache-with-let-s-encrypt-on-ubuntu-14-04
Let’s Encrypt is a great initiative to keep the web secure.
Cities of Glass
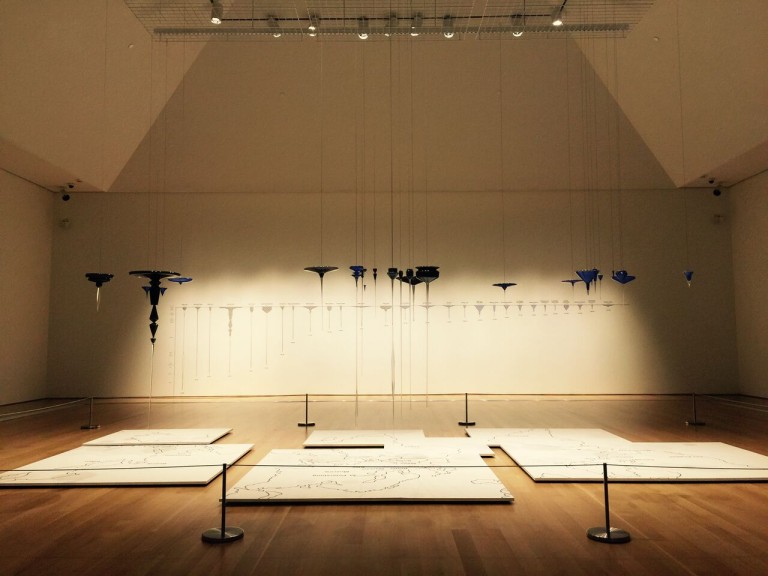
I love the idea of real world, physical implementations of data visualisation. We spend so much time behind the screen that it is really easy to just ignore something new and move on. But when its IRL, you can look at it from different angles, you can touch it and just experience the data differently. This post on hyperallergic is of a glass sculpture by Norwood Viviano that shows the big cities of the world changing overtime. Continue reading “Cities of Glass”
Welcome to Limn
Limn (verb)
 1. Depict or describe in painting or words.
  - also: This site, dedicated to the art of data visualisation.
Mostly Desert
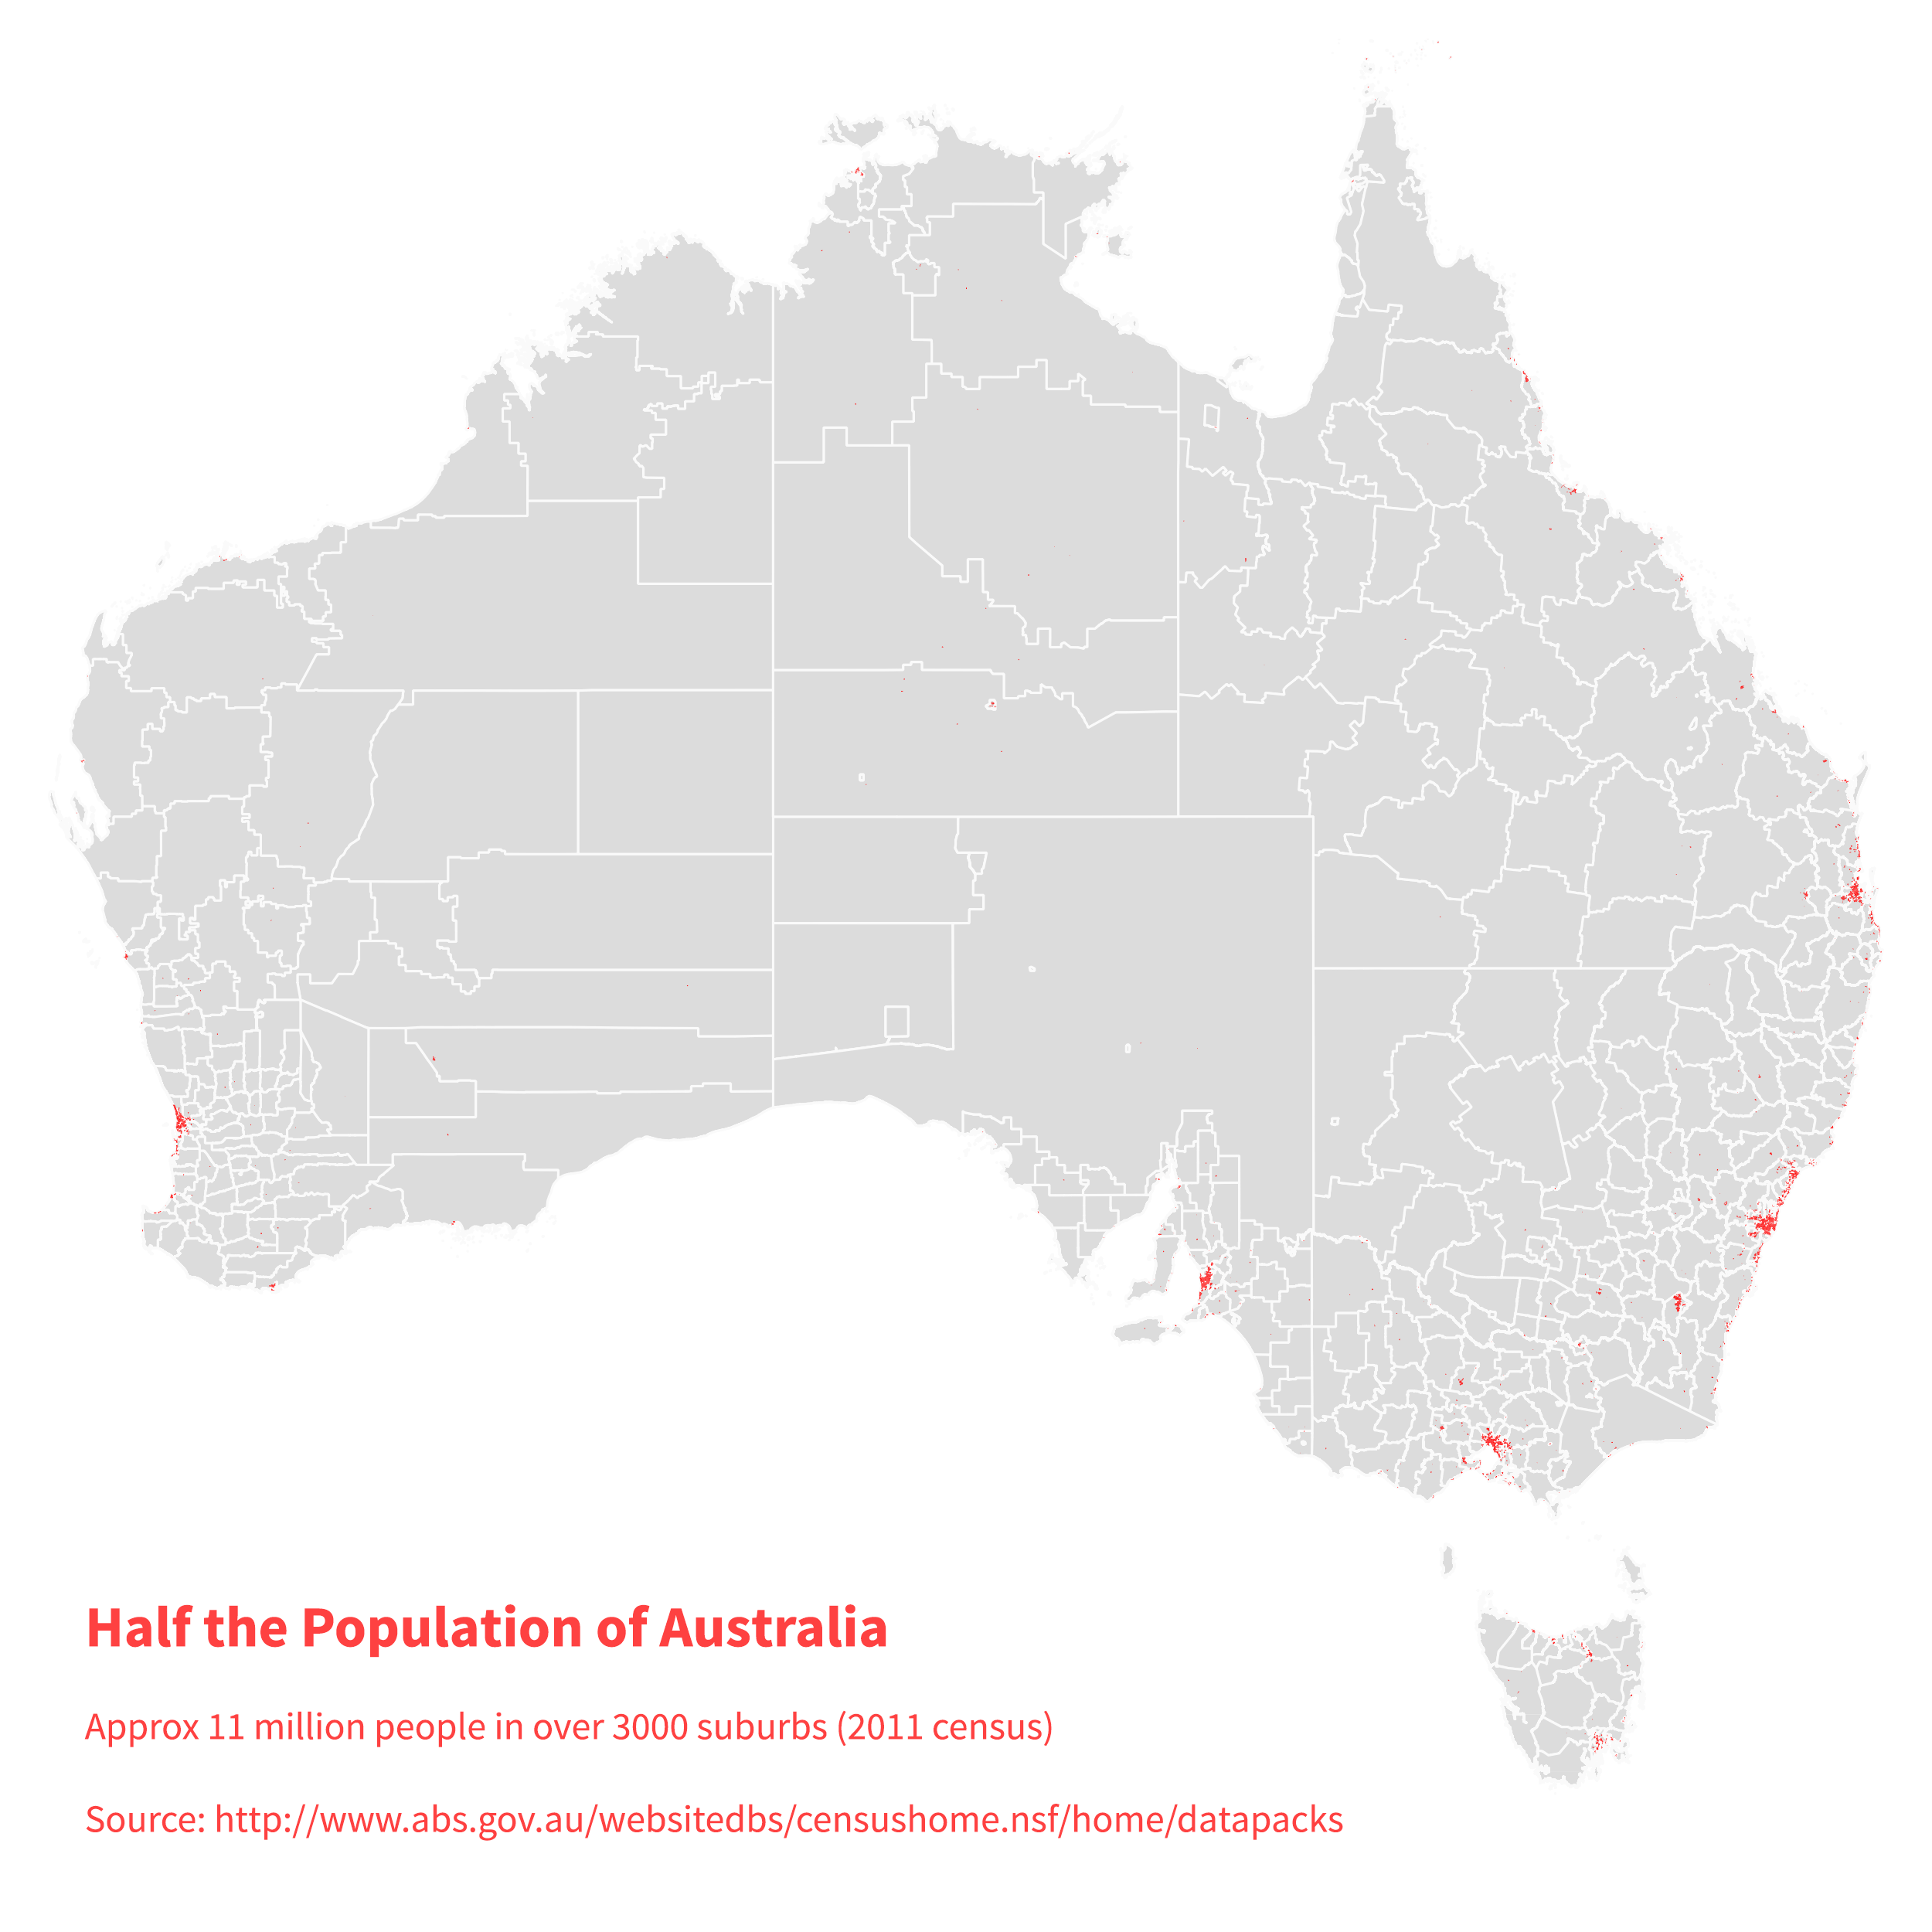
This picture shows where half the population of Australia live. Continue reading “Mostly Desert”
Shameless Self Promotion
Its been a good week. I have had my Timeline of When the World Ended data viz shared on Flowing Data and accepted into the Information is Beautiful Awards’ Long List. Go team Limn!