Posted in November 2017
Limn: PSL analysis from 2002 to the 2017 season
A guest post from Sbusiso Mkhondwane
Introduction
I have been going back and forth for a while about doing some form of data analysis and sharing it. The first attempt was to collect the data for my car's movement, from the locations I visited to the car's speed. I have four years' worth of data in a tidier format. Part of the reason for wanting to do data analysis was the R language and the book R for Data Science. R appeared like a tool that allows you to feel as if you are in control, and it's flexible. What do I mean here? Hadley Wickham once said something along these lines: "The difference between R language and other languages: programming languages provide contracts. These are the things you can do and these are the things you can't do. In many programming languages that's like a legal contract. It spells out explicitly what you can do and can't do, and things you can't do there's no way you can do them. While with R, it's more like a contract between friends, like you really shouldn't do this but if you really want to, you can go ahead and do it." Another plus for doing this is to improve my data science skill and hopefully get some useful advice from the R community.
While I had some questions I really wanted to answer based on my car's data, I hadn't really decided how to go about analysing it. While I was reading R for Data Science, in the chapter about ggplot2, a recommendation was made about three good books on data visualisation, and one of them was Graphical Data Analysis with R by Antony Unwin. On his website, Antony had an example of how to visualise the English soccer league. He used a package called engsoccerdata by James Curley. So I went into GitHub and started reading some information about this package. I had an interest in doing some analysis on the South African football league (PSL), but I realised that the package didn't have the PSL's data.
I saw this as my first real attempt at contributing to the R community, by asking if I could contribute the PSL data to the package, and he agreed. I have shared it with James and I'm looking forward to the day he includes it in his package.
Tools used
This data analysis was done in RStudio (R version 3.4.2) and mainly using the rmarkdown package. Other R packages were used in doing this analysis. I will share the rmarkdown code after adding some comments and doing some house-cleaning.
PSL results
The PSL dataset used here starts in 2002 and contains each result of the matches played since. The reason for picking 2002 over 1996 is that the PSL went from 18 teams to 16 teams in 2002, after Free State Stars and Ria Stars were bought out by the league for R8 million each to reduce fixture congestion. These teams finished the 2001 season in position 11 (44 points) and 12 (43 points) respectively.
Since then, there have been 3679 games played by 34 teams (this should be 32, which is explained next). A few teams changed their names or sold their football licence to other teams. AmaZulu were renamed Zulu Royals and later renamed back to AmaZulu (all the Zulu Royals' results have been allocated to AmaZulu), Dynamos sold their licence to AmaZulu (formerly Zulu Royals), Tembisa Classic sold their licence to Maritzburg United and Wits University were renamed Bidvest Wits. Finally, Silver Stars were renamed Platinum Stars and Benoni Premier United changed their name to Thanda Royal Zulu (this change took place during the 2007 season, therefore Benoni Premier United's results are allocated to Thanda Royal Zulu).
Overall result outcomes
The following plot shows the overall break-down of the 3679 games played from 2002 until late November 2017. The plot splits the games by result outcome (home win, draw and away win).
It shows that teams playing at home have won 1502 (40.8%) games, compared to the 1059 (28.8%) won by the visiting teams. Moreover, 1118 (30.4%) games ended in a draw. This means that home advantage is still important in our soccer.
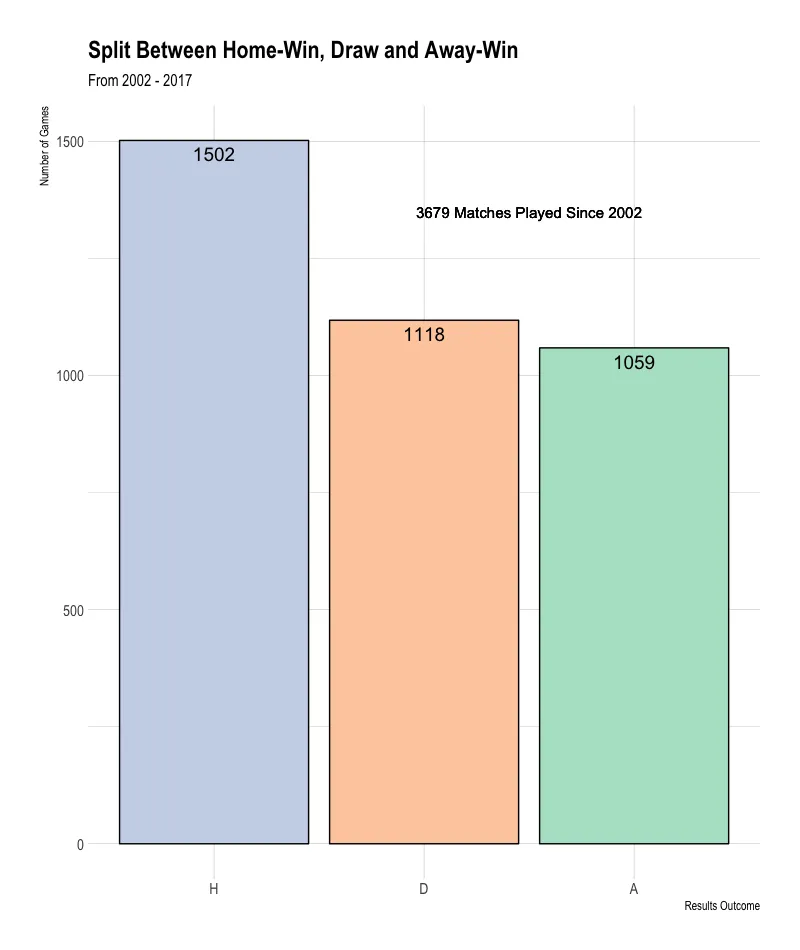
Overall home wins, draws and away wins.
Current season result outcomes
Now we look at the current season to see if the trend of home wins is still occurring as much as in the plot above. Only 79 games had been played. From the plot below, we can see that the trend is different. Could this be because the small teams have played better so far this season than the big teams? The table after the plot shows how teams are performing.
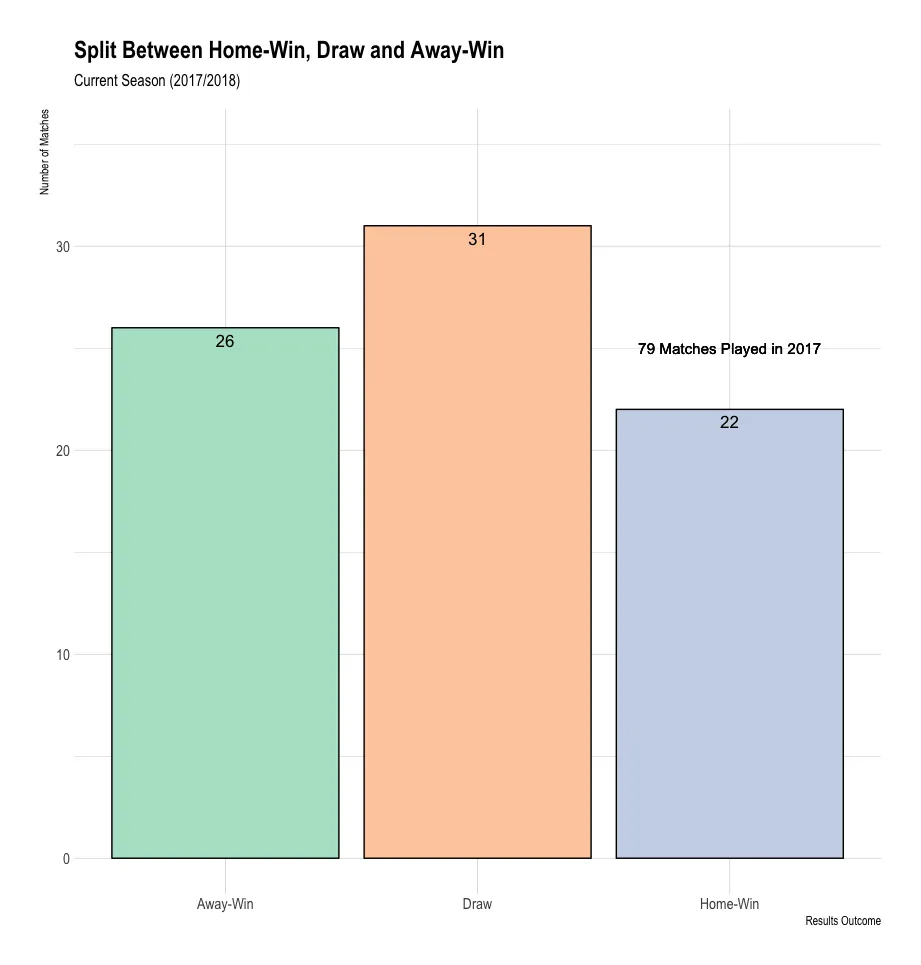
Current season results outcomes.
Mamelodi Sundowns had won the most points away from home, 15, while Baroka FC had won 9 points from away games and were the log leaders. Interestingly, Mamelodi Sundowns and Kaizer Chiefs had not won any home games so far, while Orlando Pirates had not won any away games. It does appear as if the big teams are struggling this season. The eight leading teams of the 2017 table are below.
| Team | Played | Won | Drawn | Lost | Points |
|---|---|---|---|---|---|
| Baroka FC | 11 | 4 | 6 | 1 | 18 |
| Lamontville Golden Arrows | 11 | 3 | 7 | 1 | 16 |
| Cape Town City | 10 | 5 | 1 | 4 | 16 |
| Bloemfontein Celtic | 10 | 4 | 4 | 2 | 16 |
| Mamelodi Sundowns | 8 | 5 | 0 | 3 | 15 |
| Kaizer Chiefs | 11 | 3 | 6 | 2 | 15 |
| Chippa United | 11 | 3 | 6 | 2 | 15 |
| Orlando Pirates | 11 | 3 | 6 | 2 | 15 |
Frequency of final scores
With 3679 games having been played since 2002, let's turn our attention to the frequency of the final scorelines. The idea is to look at all types of final scores since 2002, splitting the frequency by result outcome (home win, draw or away win). The plot indicates that there have been five types of draws since 2002, the most common being 0-0, 1-1 and 2-2. The not-so-common draws are 3-3 and 4-4.
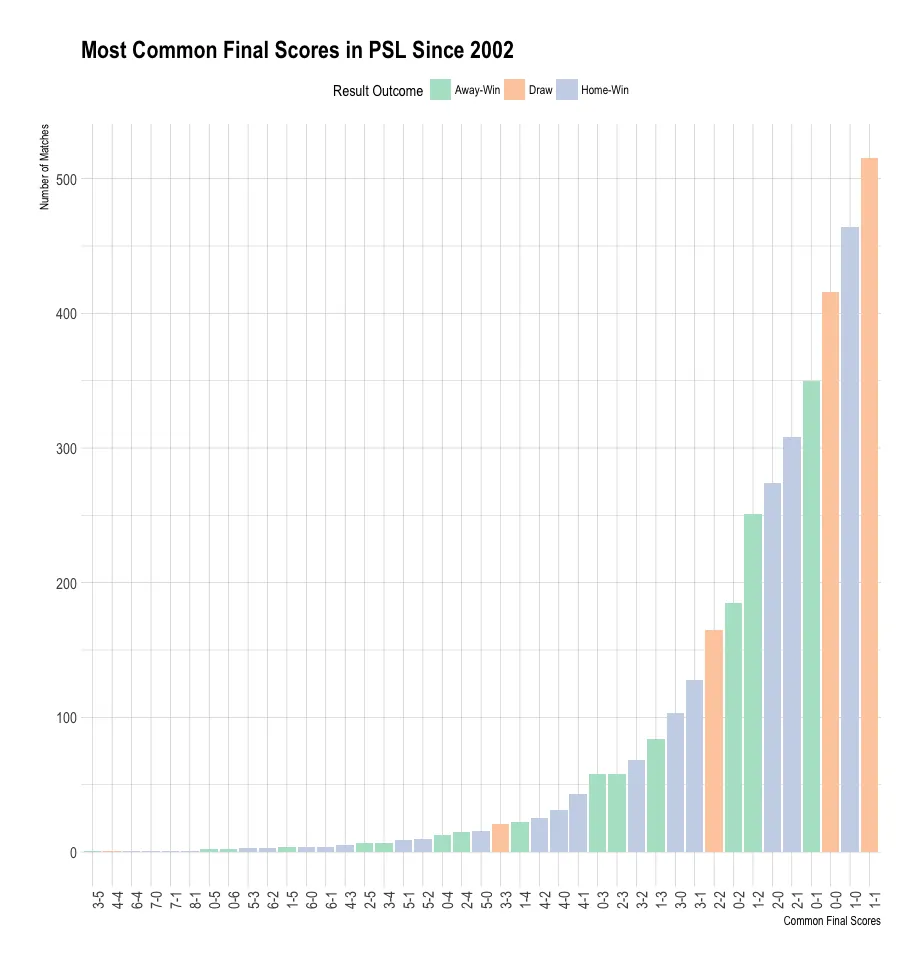
Frequency of final scores.
The table below gives a summary of the draws in the PSL, with the number of times each has occurred.
| Full-time score | Occurrences |
|---|---|
| 1-1 | 515 |
| 0-0 | 416 |
| 2-2 | 165 |
| 3-3 | 21 |
| 4-4 | 1 |
Next, the most common final scores by weekday, which is the day of the week on which the matches were played. The plot indicates that most of the draws happened on Wednesdays and Saturdays, with a number on Sundays too. Apart from most of the games being played on these days, usually on those days you could have more than four games on the day, while other days could have a minimum of one game.
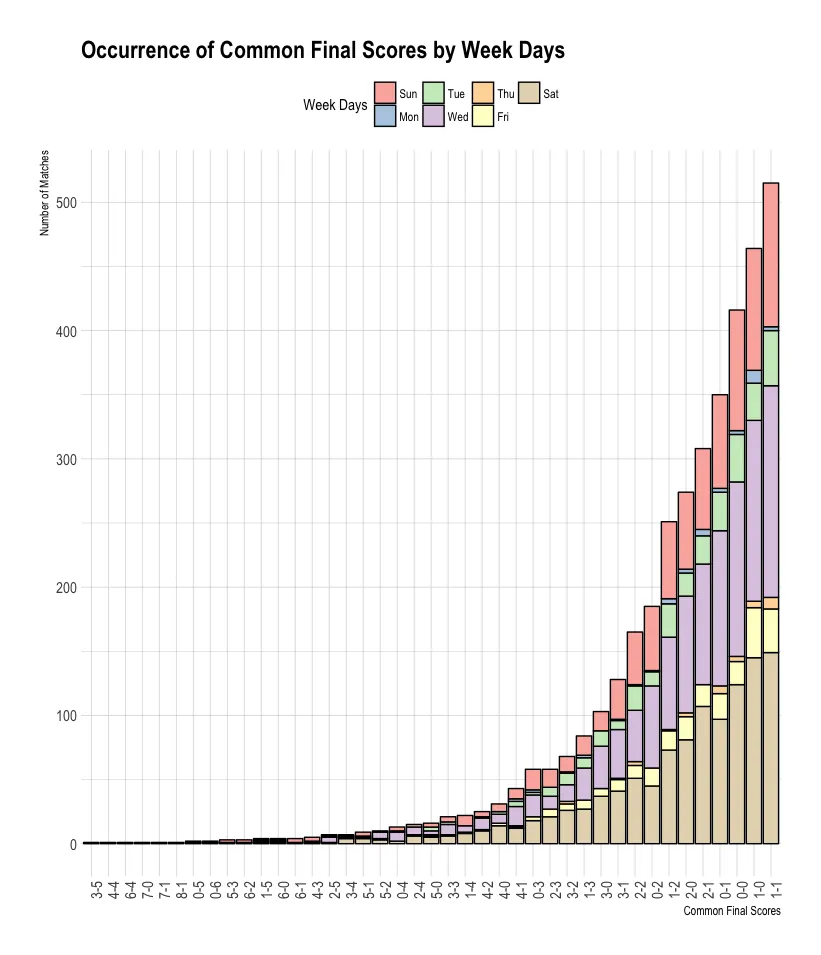
Common final scores by weekday.
Goals
We know the most common scorelines and how often they occur in the PSL. Now it's time to turn our attention to the goals. The total number of goals scored so far is 8460 from 3679 games, an average rate of 2.3 goals per game. It is interesting that the league went from the lowest goals scored in 2009 to the highest in the next season, 2010.
The question I once asked myself was which season had the most goals scored and which had the fewest. From the plot below, the season with the fewest goals was 2009, and 2010 was the season with the most goals after 240 matches. The plot shows the total number of goals scored in each season since 2002; the current season is excluded. In 2009, SuperSport United won the league having scored 51 goals and Jomo Cosmos were relegated having scored 21 goals. The 2010 season was won by Orlando Pirates with 41 goals scored, and Mpumalanga Black Aces were relegated with 19 goals scored.
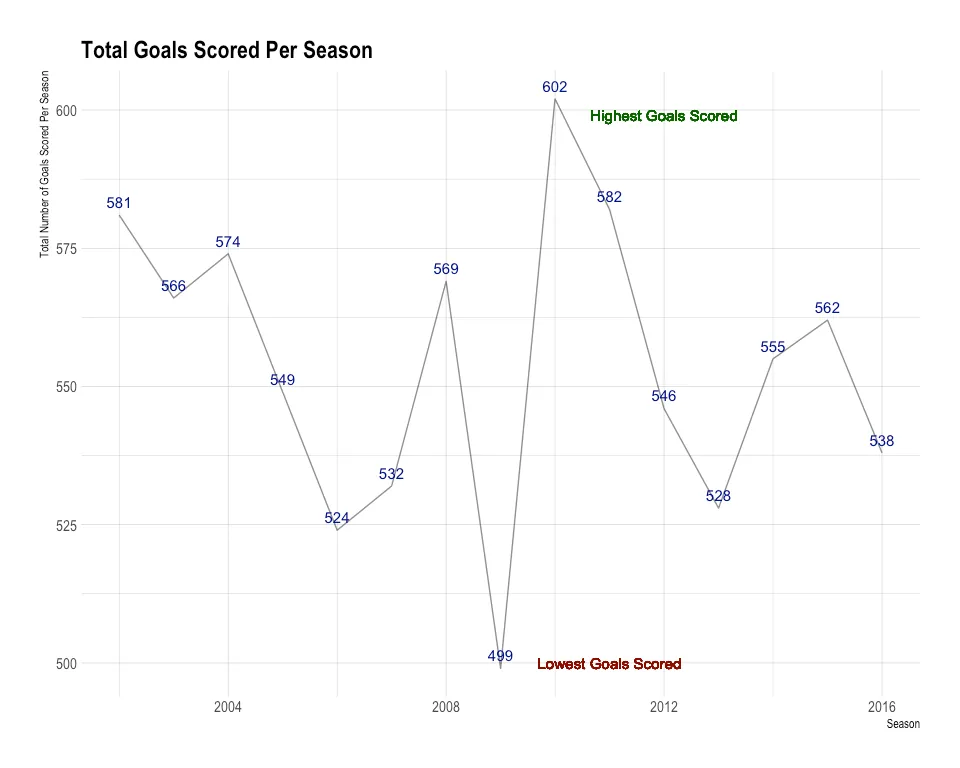
Goals scored per season.
Let's see which seasons are above the average of 2.3 goals per game. Out of the 15 seasons since 2002, 8 seasons had an average number of goals above the overall average of 2.3.
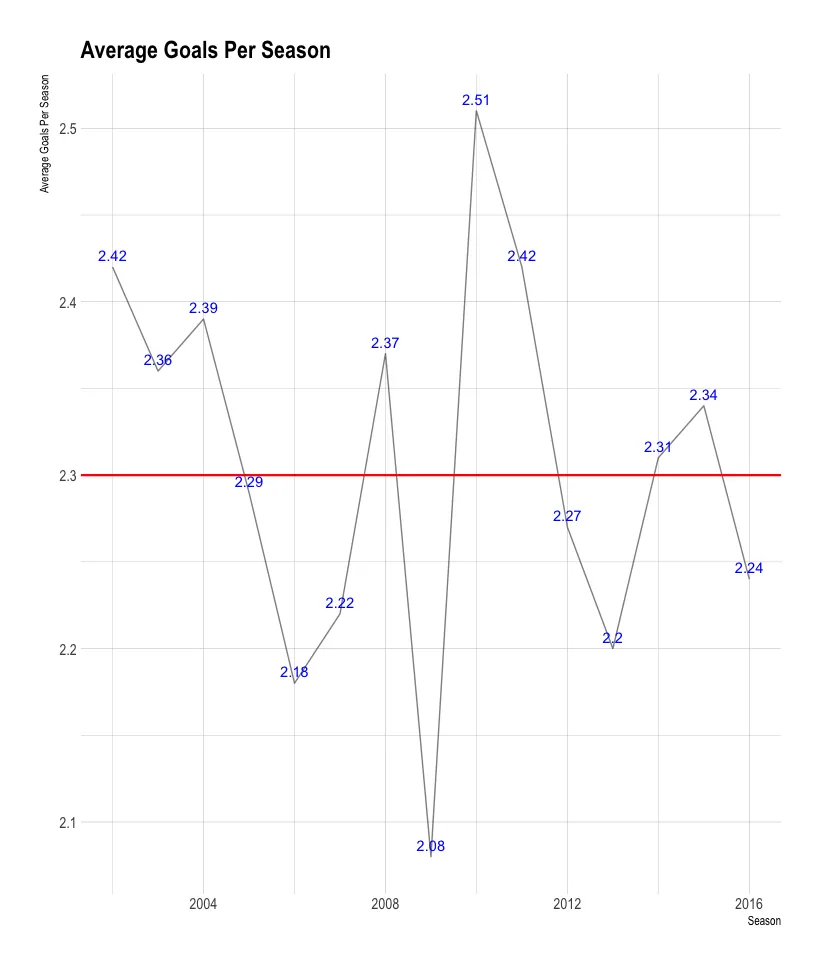
Average goals per season.
Team performance since 2002
As stated before, 32 teams have taken part in the PSL since the league was reduced to 16 teams. This section shows a cumulative view of most wins since 2002, most points won since 2002, and the overall standing obtained by combining all the points won since 2002.
Some teams were docked points for fielding ineligible players. In a match between Hellenic and Jomo Cosmos in February 2004 (the 2003/2004 season), Hellenic fielded a suspended player and had the 1 point they gained in the match deducted. On the same day, in another match between Silver Stars and Zulu Royals, Silver Stars also fielded a suspended player and had the 3 points they gained deducted. The final deduction, of 1 point, happened after Platinum Stars fielded an ineligible player in August 2015. I have also deducted points for these teams here. The ten leading teams of the combined table are below.
| Team | Played | Won | Lost | Points |
|---|---|---|---|---|
| Kaizer Chiefs | 461 | 224 | 89 | 820 |
| Mamelodi Sundowns | 458 | 229 | 110 | 806 |
| Orlando Pirates | 461 | 205 | 104 | 767 |
| SuperSport United | 455 | 197 | 122 | 727 |
| Ajax Cape Town | 459 | 173 | 161 | 644 |
| Bidvest Wits | 430 | 168 | 129 | 637 |
| Moroka Swallows | 390 | 150 | 132 | 558 |
| Bloemfontein Celtic | 400 | 132 | 134 | 530 |
| Lamontville Golden Arrows | 431 | 136 | 176 | 527 |
| Free State Stars | 340 | 99 | 120 | 418 |
The focus from here is on Kaizer Chiefs, Mamelodi Sundowns, Orlando Pirates and SuperSport United, the teams that have dominated the league since it was reduced to 16 teams. A later exercise will compare the Johannesburg teams with the Pretoria teams.
From the table above, Kaizer Chiefs have accumulated more points (820) since 2002 than any other team. They also have the lowest number of games lost, 89, among teams that have played over 300 games. In the plots, the black lines represent other teams. In number of games won, Kaizer Chiefs and Orlando Pirates were the dominant teams since 2002, but from 2014 onward Mamelodi Sundowns replaced Orlando Pirates.
Mamelodi Sundowns have won the most games, 229. In 2002 they won 11 games and finished the season in position 10. Kaizer Chiefs finished the 2002 season in position 6 and won 14 games, while Orlando Pirates won the league in 2002 with 18 games won. Mamelodi Sundowns have had an impressive rise over the years.
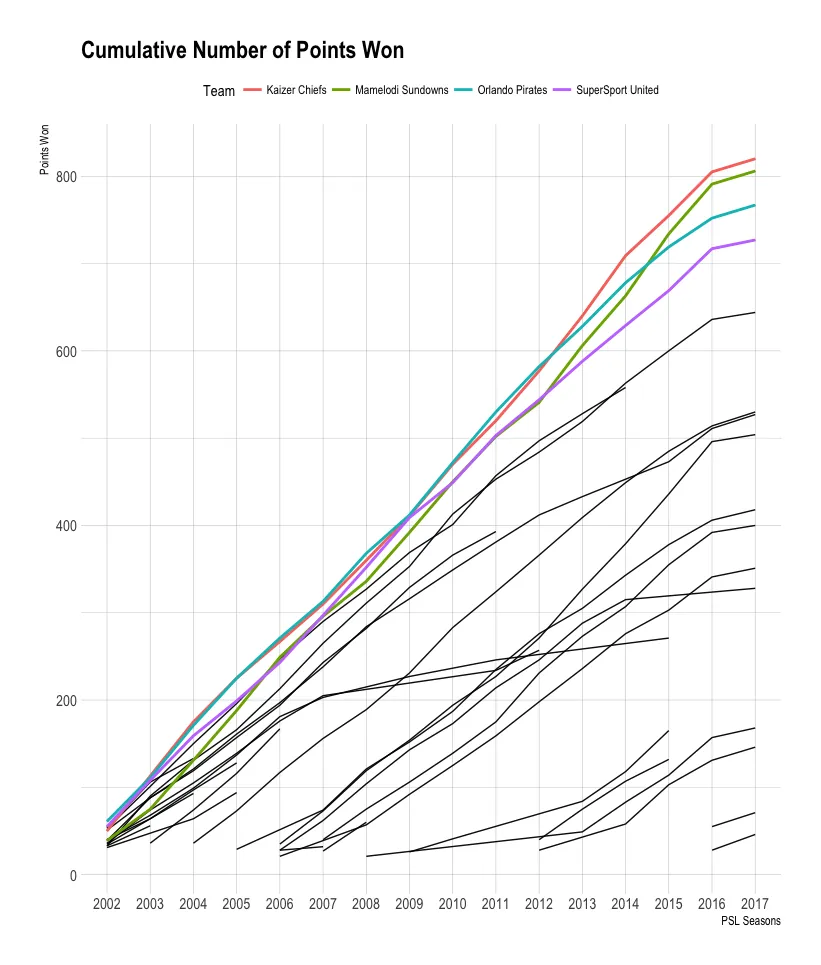
Number of points won.
The following plot is a line graph of the number of games won since 2002.
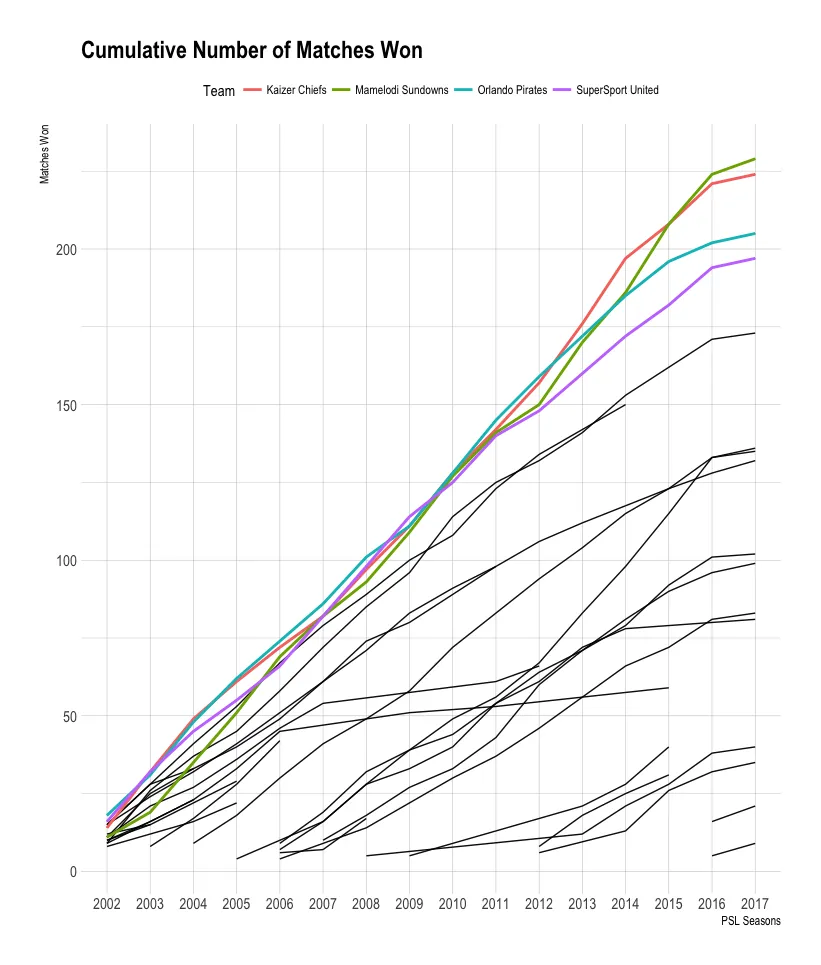
Number of games won.
Relegation and champions' points
Since 2002, a number of teams have won the league and others were automatically relegated (a team finishing 16th at the end of the league). A soccer league is about winning points. The next table shows the number of points collected by the team that won the league in each year, and the points won by the team that was automatically relegated. It also shows the difference in points between the two.
| Season | Champions' points | Relegated team's points | Difference |
|---|---|---|---|
| 2002 | 61 | 18 | 43 |
| 2003 | 63 | 22 | 41 |
| 2004 | 62 | 27 | 35 |
| 2005 | 57 | 29 | 28 |
| 2006 | 61 | 21 | 40 |
| 2007 | 54 | 22 | 32 |
| 2008 | 55 | 21 | 34 |
| 2009 | 57 | 24 | 33 |
| 2010 | 60 | 15 | 45 |
| 2011 | 58 | 19 | 39 |
| 2012 | 57 | 23 | 34 |
| 2013 | 65 | 21 | 44 |
| 2014 | 69 | 27 | 42 |
| 2015 | 71 | 25 | 46 |
| 2016 | 60 | 27 | 33 |
Way forward
Since this is my first attempt at doing this and sharing it, I plan to do at least one data analysis a month, based on having interesting data. Chances are my next attempt will be on soccer again, focusing on the PSL coaches and a time series of goals scored. If I can get the data related to the issuing of yellow and red cards in the history of the PSL, I will look into that too.
I plan to build a Shiny application that will let people explore this PSL data interactively, and also include game predictions. I tried to ensure that there are no errors in the PSL results data and I hope there are none, as I checked and rechecked, but I'm human and should be allowed to make some mistakes. I hope people find this analysis enlightening and interesting.
Thanks
I would like to thank James Curley for the R package which inspired me to source the PSL data so I could do this analysis. Thanks to Antony Unwin, author of Graphical Data Analysis with R, for the examples on his website and in his book. Thanks to Hadley Wickham for making R such a pleasure to work with. Finally, I would like to thank Jeff Fletcher of Limn for allowing me to publish my data analysis on his site, and my friends who took part in this exercise. The data was sourced from KickOff and Wikipedia.