Really Old Data Visualisation Book

If you are into this sort of thing, Microsoft and the Internet Archive have digitised a copy of the 1919 epic Graphic Methods for Presenting Facts by Willard C. Brinton. While not one of the original seminal works, it still shows that the thinking that goes into basic information display is a lot older than we generally assume. And it has some very cool illustrations, which today would get you a post on viz.wtf.

War, slightly more wasteful than coffee

Continue reading “Really Old Data Visualisation Book”

One Year of Comrades Training

On a recent job at Discovery to do some analytics for Vitality, I was looking at data that is recorded into their platform as part of their insurance linked wellness program. There are various activities that are tracked as part of the program and a fair amount of it is running data. Given the size of their customer base it’s fair to assume that many of them have run the Comrades Marathon, and I wanted to see what all those runner’s various training programs looked like. Continue reading “One Year of Comrades Training”

Misery Index

There have been a couple of articles recently that have spoken about South Africa having a bad Misery Index rating. Its quite a harsh term, but ennui index or “not cool man” index isn’t going to grab headlines. Like a lot of statistics reported in popular media, it tends to be reported as a snap snot number at a particular time rather than the trend. So here is a historic plot that shows how miserable we have been since 1994.  Continue reading “Misery Index”

Jerry Mander

par_mander_01
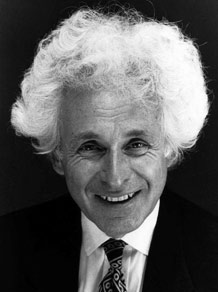
Since this is an article about gerrymandering, I thought I’d go with a clever, catchy title like Jerry Mander. Ha! But.. it turns out he is a real guy (pictured on the right) with real crazy hair and has written a book about the dangers of television. He also wrote a book about the flaws of capitalism. I get a sense he is just against things (including combs). This article is actually about the other kind of gerrymandering:

n. The practice of redrawing electoral districts to gain an electoral advantage for a political party.

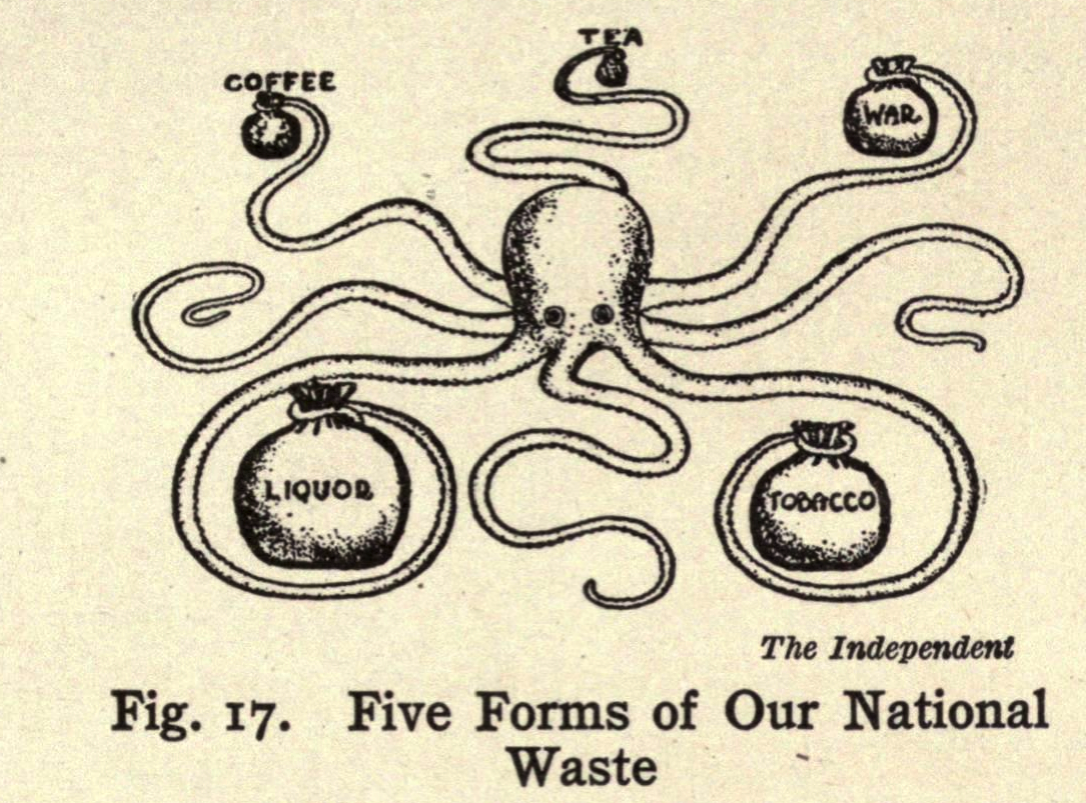
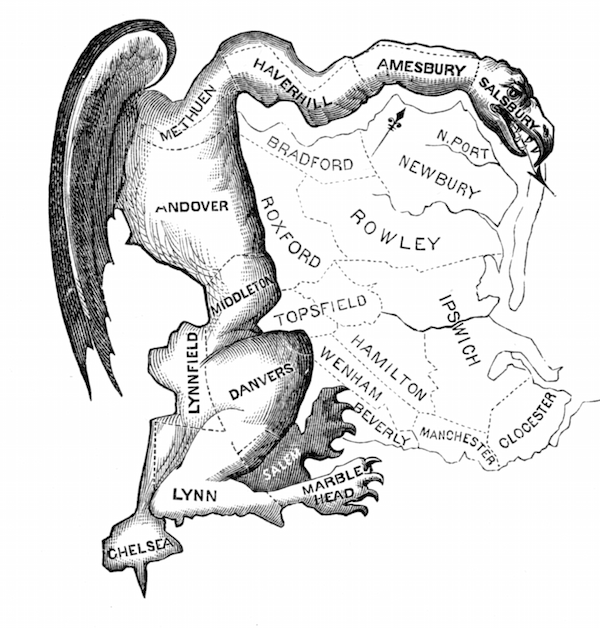
You can read all about gerrymandering online. Its not a new practice. The picture below was published when the term was first coined in 1812.

The_Gerry-Mander_Edit

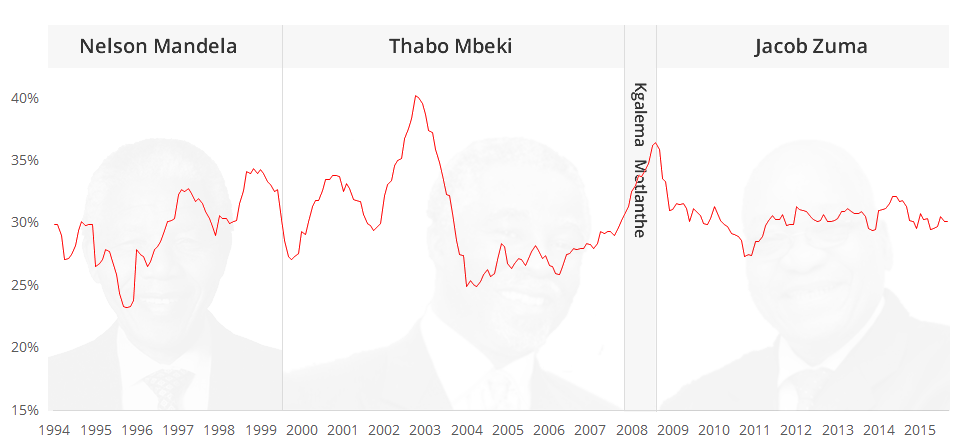
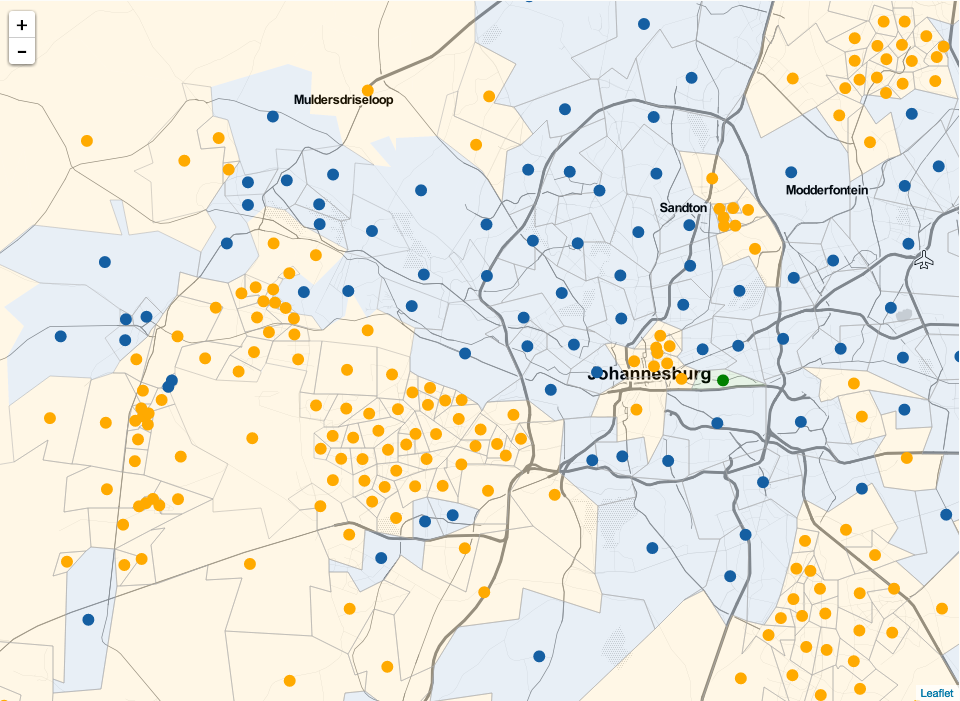
What I’m wanting to show here is how this relates to a South African context. With the next municipal elections coming up soon, its interesting to see how our electoral system implements the notion of voters vs. voting district. Continue reading “Jerry Mander”

Cities of Glass

I love the idea of real world, physical implementations of data visualisation. We spend so much time behind the screen that it is really easy to just ignore something new and move on. But when its IRL, you can look at it from different angles, you can touch it and just experience the data differently. This post on hyperallergic is of a glass sculpture by Norwood Viviano that shows the big cities of the world changing overtime. Continue reading “Cities of Glass”

The Wedding Photographer Problem

Jason posted yet another awesome edition of the Naked Data newsletter (which you should all definitely be reading). In this particular issue (#75) there is article entitled: Automatically generate beautiful visualisations from your data. Although there is a lot of snark in that title, the author is basically saying that good data visualisation is difficult and requires someone with training and experience if you want a decent end product. Continue reading “The Wedding Photographer Problem”