Posted in August 2017
Limn: peak rationality
This is the first of a series of semi-weekly visualisations. "Semi-weekly" in this case is ambiguous, like bi-weekly is, so like whenever. It will be depictions of a concept or thought (or even actual data) when time and inspiration coincide.
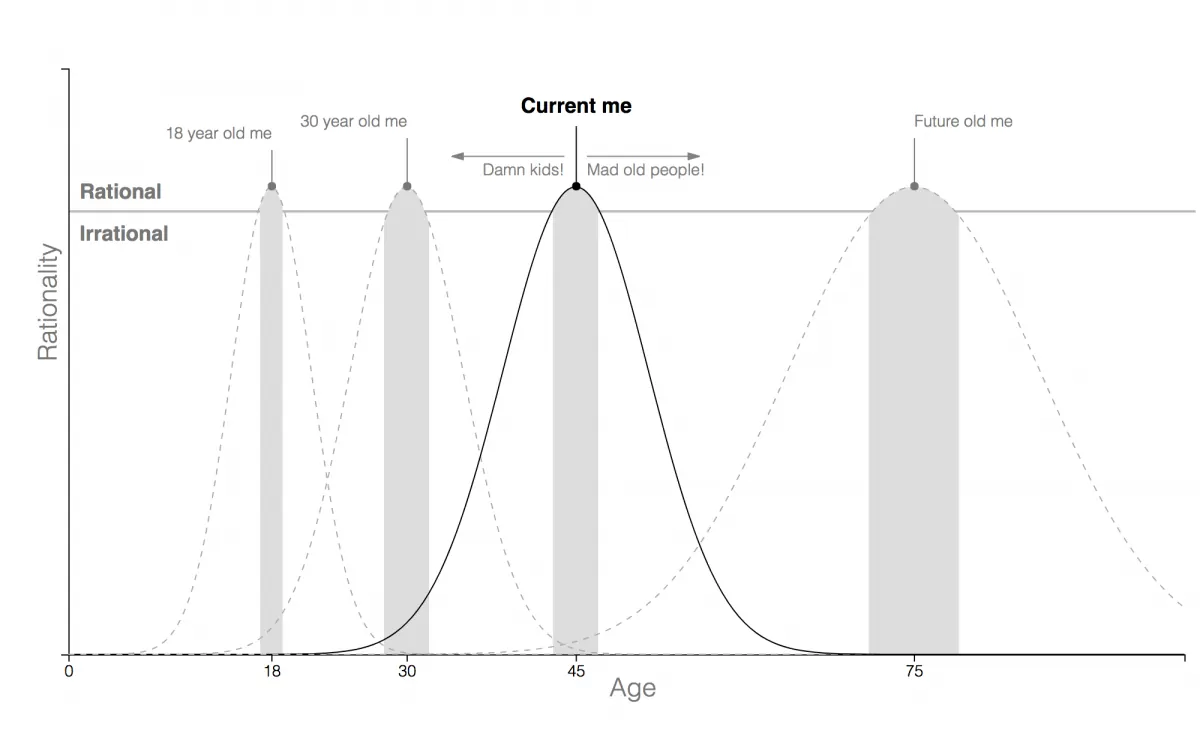
Having recently dealt with the combination of being weirded out by people younger than me doing stupid things and annoyed by people older than me doing stupid things, I started to wonder if everyone who is not me is being irrational. Or maybe it's an age thing. You don't see pictures of 45 year olds hanging precariously off tall buildings for no reason.
And arguing with a 90 year old with almost zero eyesight as to why they shouldn't be driving is less fun than it sounds.
At 45, have I reached peak rationality? People either older or younger than me seem to be irrational.
The younger me was certain he was being rational, and the older me will think the same thing. Frankly I'm surprised to have made it to this age considering some of the stupid, irrational things my younger self did. And I'm likely to want to carry on driving well past where it's considered rationally safe. I assume we have this moving window of perceived rationality that moves with us as we age. And everyone not in my age group is wrong.
D3 learnings
A couple of new d3 capabilities learned while making this. The d3-annotation plugin from Susie Lu is useful for highlighting specific data points. A bl.ocks.org example by Phil Pedruco shows how to plot a bell curve. The area.defined option in the d3-shape documentation limits an area plot to specific regions.