 Since this is an article about gerrymandering, I thought I’d go with a clever, catchy title like Jerry Mander. Ha! But.. it turns out he is a real guy (pictured on the right) with real crazy hair and has written a book about the dangers of television. He also wrote a book about the flaws of capitalism. I get a sense he is just against things (including combs). This article is actually about the other kind of gerrymandering:
n. The practice of redrawing electoral districts to gain an electoral advantage for a political party.
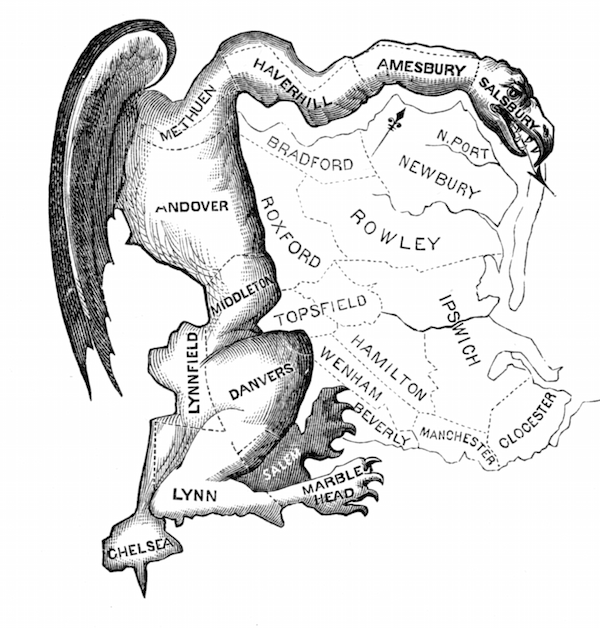
You can read all about gerrymandering online. Its not a new practice. The picture below was published when the term was first coined in 1812.
What I’m wanting to show here is how this relates to a South African context. With the next municipal elections coming up soon, its interesting to see how our electoral system implements the notion of voters vs. voting district. While working on some d3 mapping code to overlay election data, I had a data set from the IEC for the 2011 municipal elections R and was just fiddling with the numbers, as you do when you are a data nerd. What struck me as particularly odd was the difference between the number of votes vs the number of wards won between the ANC [Yellow] and the DA [Blue].

The ANC won 62% of the votes, but won nearly 80% of the wards? At first I thought I had an error in my data, but I checked and validated against other sources.
| Other Wards | 199 |
| DA Wards | 674 |
| ANC Wards | 3,404 |
| Total Wards | 4,277 |
| Other Votes | 1,971,421 |
| DA Votes | 3,216,006 |
| ANC Votes | 8,405,429 |
| Total Votes | 13,592,856 |
This is based solely on the PR ballot votes (and includes spoilt votes) and the data is all from the IEC’s website. There are different kinds of ballots: a ward ballot, a PR ballot and a DC 40% ballot. The differences between the totals for PR and ward votes were marginal. I used the just the PR votes for this as it had marginally more actual voters, so it should be the most representative of how individual South Africans actually voted.
The one thing I could not find was a canonical list of all ward councillors and which party they belonged to, but it seems reasonable to assume that the ward councillors were allocated based on the party with the most votes in that ward as per the IEC site. If I’m wrong on this, please can you comment about how it actually works.
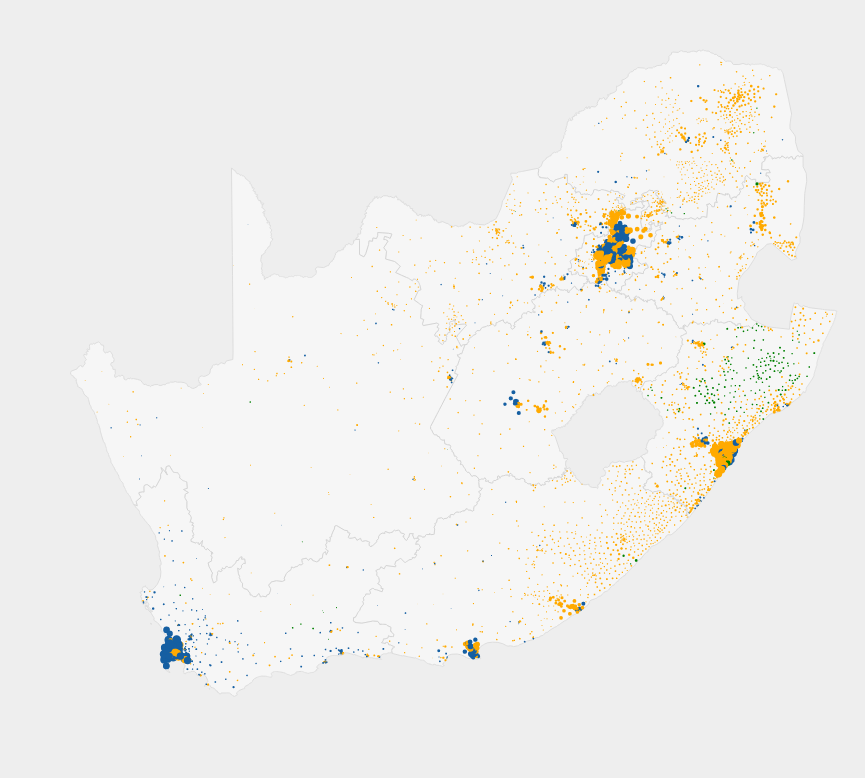
Lets delve a little into visualising the problem. South Africa has a couple of urban clusters where most people live. The map below shows the concentrations of wards. Each dot is a ward and bigger dots have more voters. The [Green] dots are wards that were won by another party.
Its all a little cluttered and hard to see, so the image below is an expanded view using a d3.force based layout to spread things about and prevent overlap. If you are on a fast enough PC, you can watch this expand in realtime here.
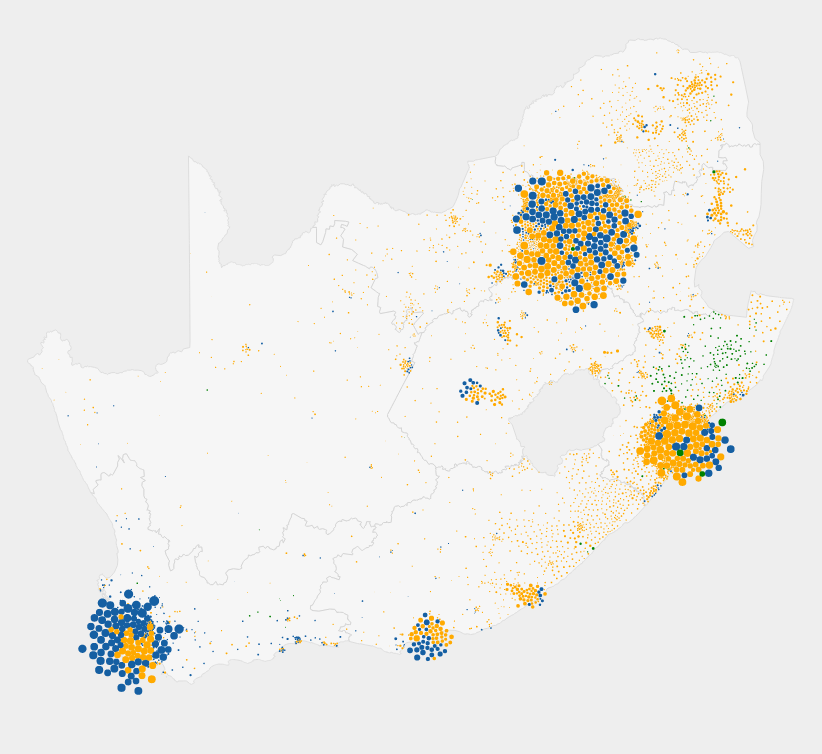
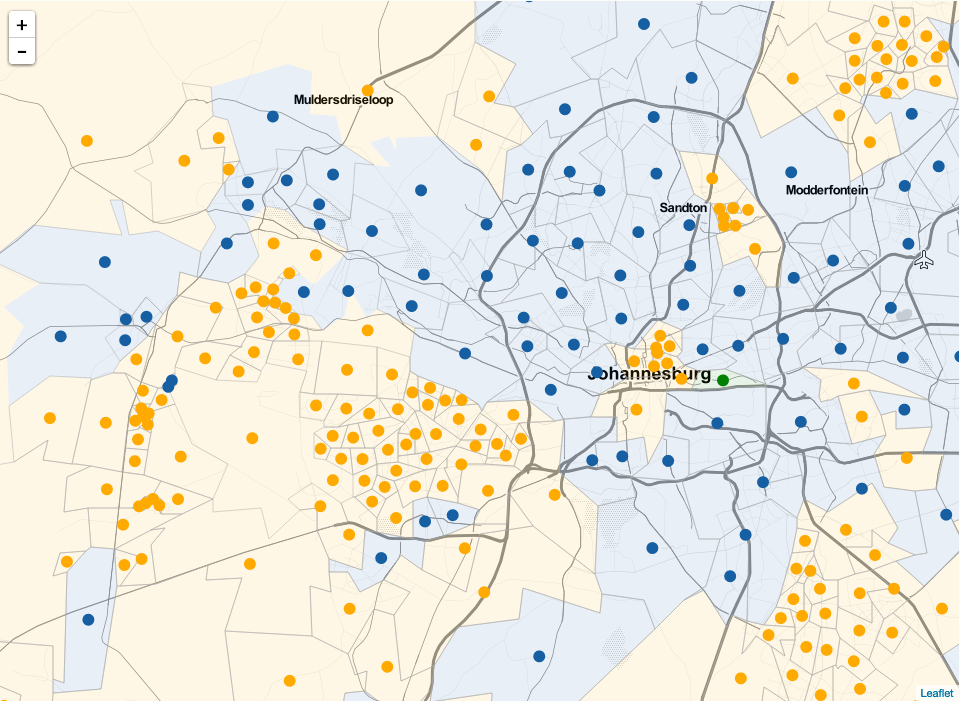
There are lots of little wards with lots of people in them, and the distribution of the ANC looks like a lot more than the 62% of votes they won. The picture below zooms in even closer. You can see that for Johannesburg the DA wards are bigger wards while there are a lot more smaller ANC wards.
This is not conclusive, but when you look at the averages across the wards, a specific pattern emerges. In the image below, the first graph is a histogram of ward sizes. The bins are ward sizes growing at 2km² per bin. Over 400 wards are less than 2km². The ratio graph below that is ratio of the number of wards won between the ANC and DA, and does not consider other parties. The ANC has a greater than 90% success rate in smaller wards. As the wards get bigger, the DA has more success against the ANC.
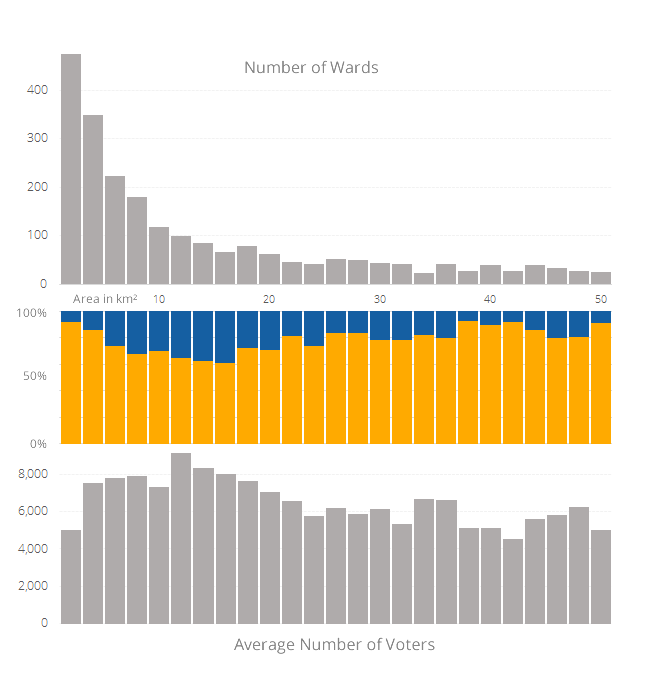
The other curious artefact is the big jump in the average number of voters between the tiny wards (less than 2km²) and the next few steps as per the last graph above. I would think that a true proportional representation model would try to allocate approximately the same number or people per ward. To get this right would require making some of the smaller wards bigger, and some of the the bigger wards smaller.
This brings about the question of is this gerrymandering? Without knowing the intentions of the those who run the demarcations board, it is impossible to say. The way things are implemented at the moment, it certainly looks to favour the ANC. The real question is do you have the ward councillor most of you voted for?


