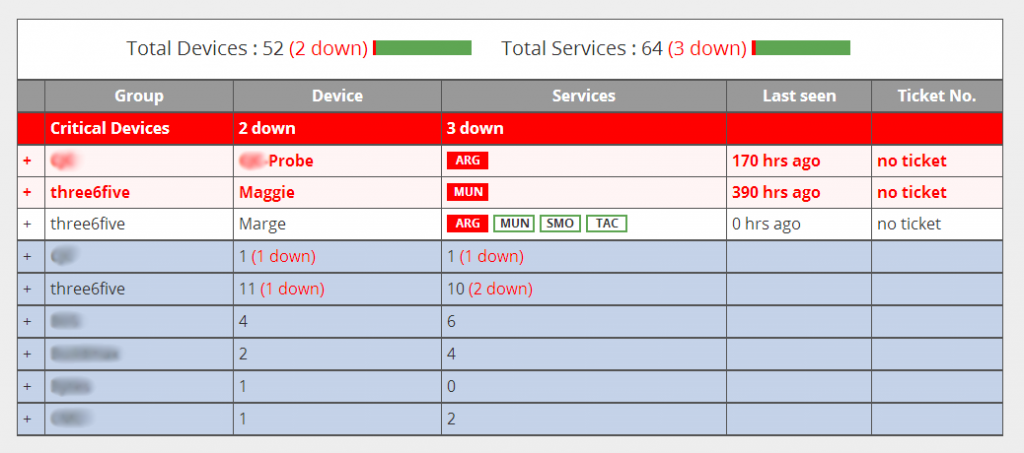
Another three6five related project was the requirement to create a dashboard for our support team to have an overview of all the probes that we have deployed on site at our customers. Specifically it needed to firstly highlight any probes that are not functioning, and then any services on an active probe that are not functioning.
This will live on a big TV screen in our support centre and can be seen from anywhere in the office. While we send out notifications, its good to have a easy to view list of all the issues that are being dealt with.
Using the guide lines from Information Dashboard Design by Stephen Few, the objective of a dashboard is the:
Visual display
of
the most important information needed to achieve one or more objectives
which
fits entirely on a single computer screen
so it can be
monitored at a glance
I had to forgo a lot impulses to do cool graphs and widgets on the page to meet these criteria.
This built using D3 connecting to our custom probe monitoring system. The probe monitoring system is a vast and complex implementation built by my very clever colleague Richard.


