Making a Cartogram

Mike Bostok has a fantastic tutorial on how to make a map using d3 and topojson. Having done some mapping work recently for a client, I was keen to learn more and try do a d3 based cartogram. I found some good examples of non-contiguous cartograms, but I wanted to make a South African version of a contiguous one using Shawn Allen’s d3 implementation.

Here is the final product, and I’ll take you through some of the tricky parts that I had to deal with.

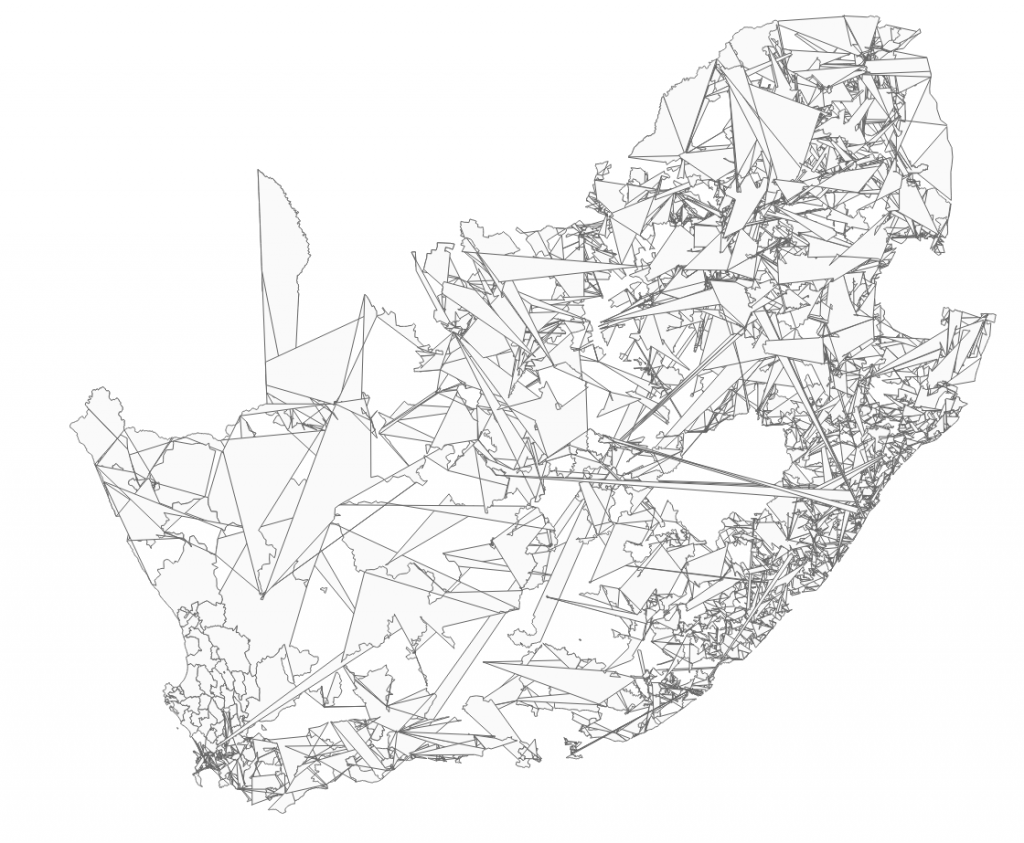
Continue reading “Making a Cartogram”

RAW: A Data Visualisation Application for Non Programmers

air-bender

I created the above SVG using RAW which shows the steady decline in the popularity of M. Night Shyamalan’s filmography. It really was just a cut and paste of the data from the web, to excel and into RAW. RAW creates vector graphics (i.e. SVG) from spreadsheets (i.e. TSV). The app should have been called TSVG. I’ll make some calls.

It helps if you have used some of the graph types before to know how they work best with the source data. Maybe it will spur some people on to get to grips with D3 more.