http://www.limn.co.za/dev/census
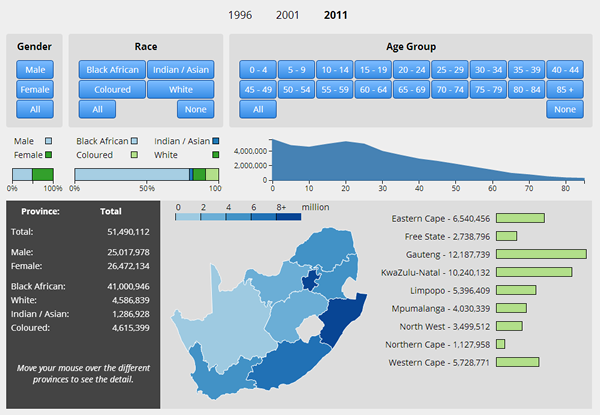
With the publication of the final data for the South African 2011 Census, I built an interactive application using D3 and the published census data to try make the presentation of the information more useful. The issue with the census data is that it has either been summarised and presented in a PDF document with a particular view in mind, or you have to go digging into the data yourself to find what you are looking for. Assuming of course that you know what you are looking for before hand.
I was looking for a way to present a fair amount of information on a single screen while allowing interactivity and exploration. This allows you to play and discover new aspects of the data that you may not have previously thought about.
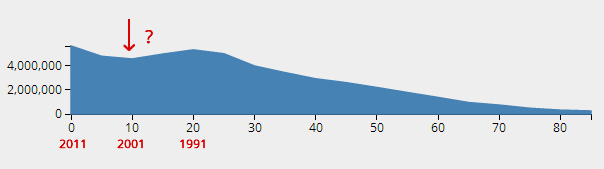
The first interesting anomaly I found was a decline in the number of children born in 2001. I have no idea why that is, if its a data problem or clear indication of alien abductions, but this presentation format allowed me to more easily think of questions to ask about the South African population.
The census data was pulled from the Statistics South Africa website and converted to JSON format using python. There was some inconsistency in the presentation format of the data between the different years, so some data had to be discarded. This was never more tha 1% of the total available data though.
The rest of the application is written entirely in Javascript using D3.