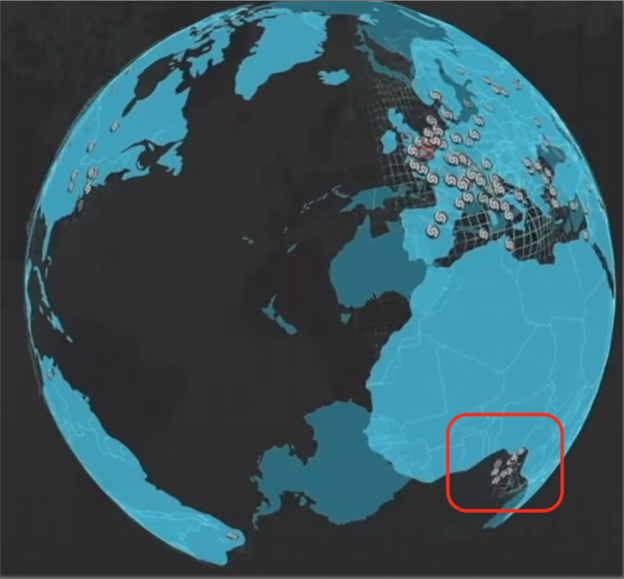
I had the pleasure of watching Cait O’Riordan speaking at last week’s Strata Hadoop in London. While she presented a fantastic talk, the one thing that struck me was a brief visualisation showing Shazam user activity around the world. Continue reading “Shazam’s huge São Tomé and Príncipe User Base”
Category: Uncategorized
Skirt Width vs Beard Frequencies
I do like a good graph about beards, but when it makes a correlation with other fashion items, its even better. This lovely piece in The Atlantic covers beard length and general facial hair coverage as far back as accurate recordings go. As interesting as it is, this graph made it worth reposting: Skirt Width vs Beard Frequencies. Continue reading “Skirt Width vs Beard Frequencies”
Naked Data Newsletter
If you aren’t yet a subscriber, you should be: http://code4sa.org/newsletter/
It is one of the most interesting sources of South African specific data, and data science and visualisation in general.
MammothBI video
I’m rapidly running out of my allotted video time on YouTube that does not include a cat.
The recording is from the MammothBI conference from last year. It was a great event, modelled on the TEDx style and very professionally handled. Well done to Jason Haddock and the team for doing such a great job. Looking forward to going again this year.
Anatomy of More Songs
Here is an update to the Anatomy of Songs Data Viz. I learned the term “man bun” from this. It fits well.

Data Viz Meetup Joburg
There is another Data Viz meetup tomorrow night (17 Feb 2105). Adi Eyal is giving the talk and he is one of the best data gurus in South Africa.
http://www.meetup.com/Data-Viz-Meetup/events/220487219/
Video from Cape Town DataViz MeetUp
I presented my Making a Choropleth Map talk at the Cape Town DataViz MeetUp last year. Here is the video recording from it. A big thank you to Adi Eyal and the Code4SA team for hosting the event.
What is Big Data?
This is the quote for 2014 for me, from Stephen Few:
Big Data is a rapid increase in public awareness that data is a valuable resource for discovering useful and sometimes potentially harmful knowledge.
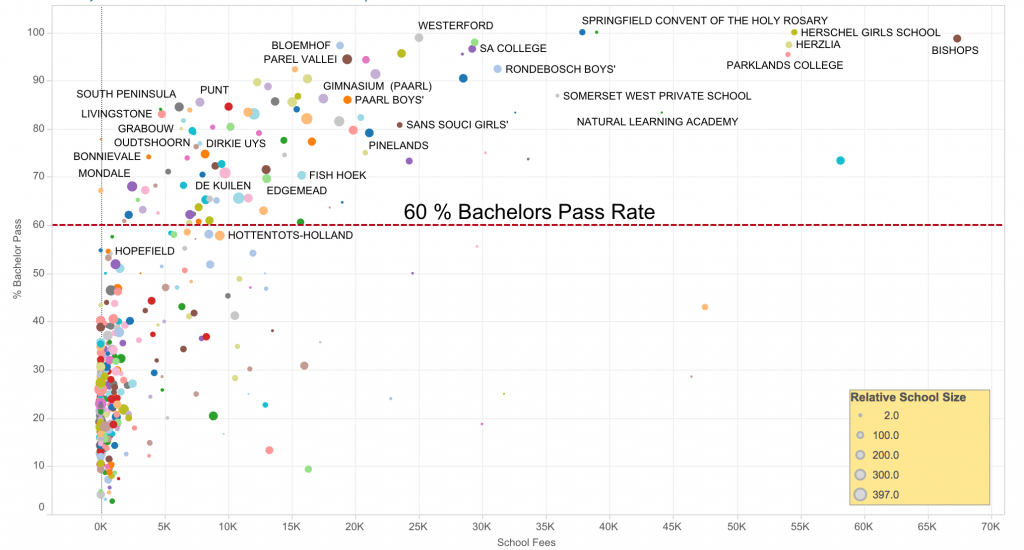
School Fees vs Bachelors Pass Rate
Guy Taylor sent me a link to a data visualisation that shows the bachelors pass rate for western cape schools. I quite like the intention and the implementation. Plus I guess I will have to re-install tableau public to look at the data.
Those Wacky Cartographers
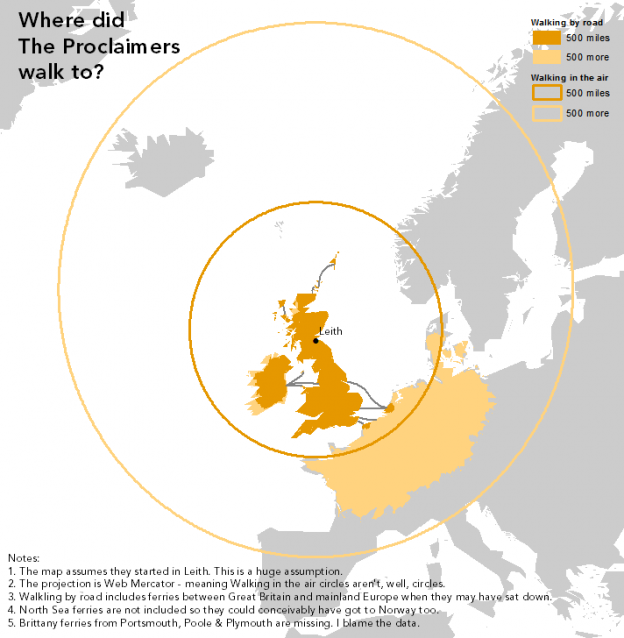
In 1988 the Proclaimers unleashed the song I’m Gonna Be (500 miles) on an unsuspecting pub song singing audience. It quite likely the created the first song in the world that if you were caught not singing along to the chorus, you would be ejected from the pub and publicly shunned until it was your round.
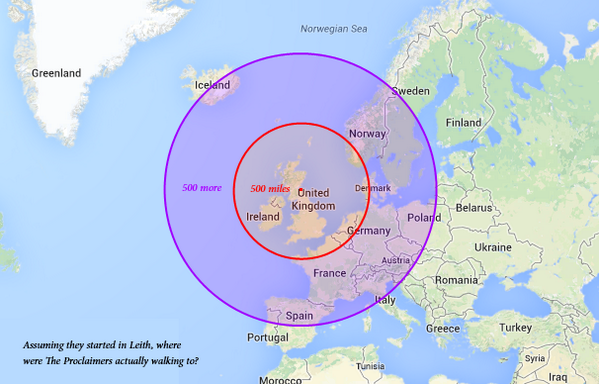
That song did get me to think about what it would be like walking 1000 miles (500, and then 500 more). That’s about the distance from here to Cape Town, which is an uncomfortable flight or a very dull, tiring drive. Walking it would be madness. For the Proclaimers, who presumably started in Leith, walking 500 miles in any one direction poses a logistical problem. Enter the cartographers. The first map exploring this problem would have been how I would have looked at it too:


