Watch John Oliver deliver a masterful lesson in Data-Ink Ratio for television.
Category: Uncategorized
RAW: A Data Visualisation Application for Non Programmers
I created the above SVG using RAW which shows the steady decline in the popularity of M. Night Shyamalan’s filmography. It really was just a cut and paste of the data from the web, to excel and into RAW. RAW creates vector graphics (i.e. SVG) from spreadsheets (i.e. TSV). The app should have been called TSVG. I’ll make some calls.
It helps if you have used some of the graph types before to know how they work best with the source data. Maybe it will spur some people on to get to grips with D3 more.
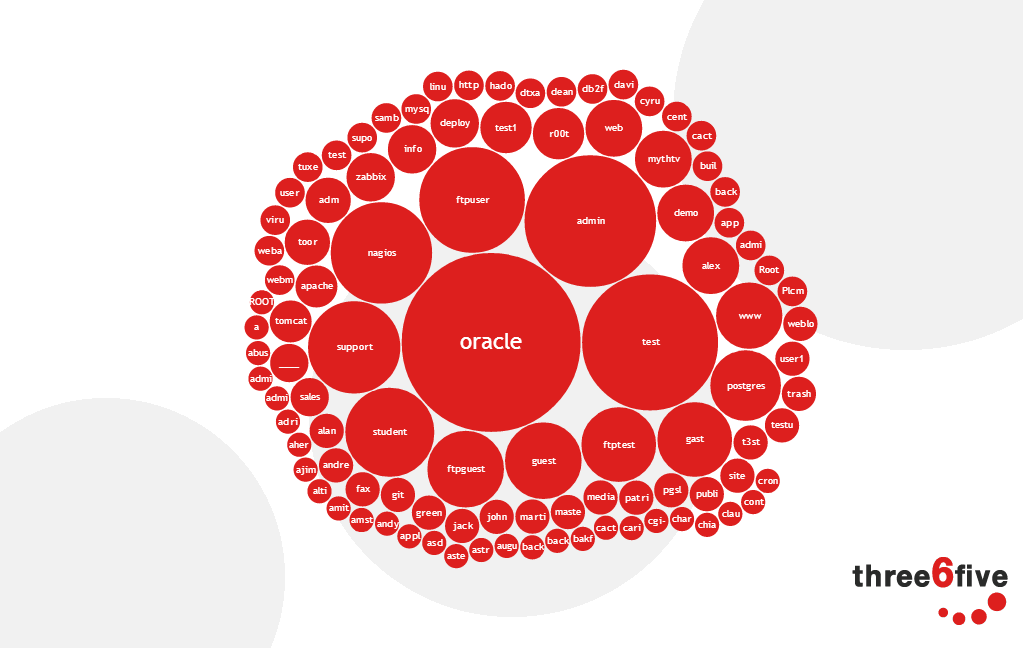
Honey Pot Project
At three6five, we undertook a project to put run honey pot server on a local internet connection to see what the threat levels are. This a self guided presentation to take you through the results. This was my first real exploration of the D3 library. The actual presentation framework also uses D3 and something called Stack by Mike Bostock, one very clever dude!


